- EPA proposes tougher downwind pollution rule as Senate votes to block Obama climate plan
- A reminder: For Friday: choose your topic -- either lead or
surveys, and let me know if you'll be working alone or with a partner.
Please give me a one-page description of your plans (just so that I have something). Then I can begin to make targeted suggestions.
- I've been working on my reports, and I hope that you'll get started with yours soon.
First of all, Kara has double entered the data, and we'll check several of the forms where there was some discrepencies, to decide on whether to accept them or not.
Surveys Forms 23, 24, 43 (W or X); and Form 27, which appears to be from Covington.
I want to tie up a few loose ends on the lead stuff, then, when we're finished with that, we'll come back to how to proceed with the proportions we're dealing with in the survey. (source)
-
I've sealed the lead data. I'm trying to work out a few details, and
I'll present the complete data sets on Friday. At the moment I have this:
I'm working on getting my model for soil lead profile sorted out: preliminary looks like this: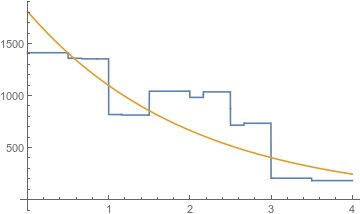
- We have proposed a solution to the problem of toxic levels
of lead, that doesn't require moving soil to or from the site.
- We need to discuss how to map lead for all of Newport, if
possible -- based on assumptions such as
- Finally we need to consolidate this into a summary report.
- Let's review what we might expect for Newport lead levels, based on the
assumption that the smelter was the cause of lead pollution in
Newport (why might that not be a good assumption?).
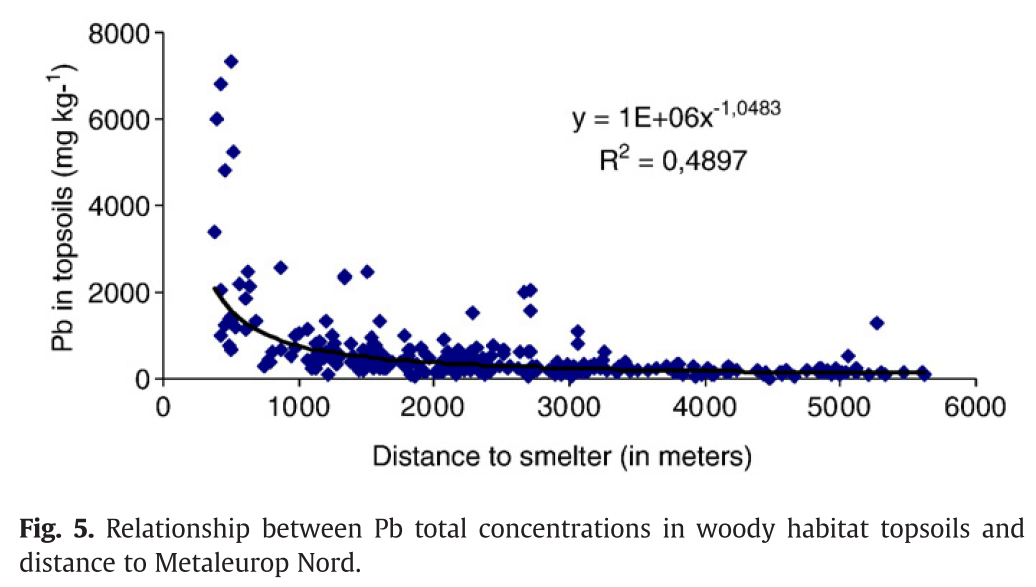
- I did a search of lead pollution
patterns, and found
this interesting study and the associated graphic:
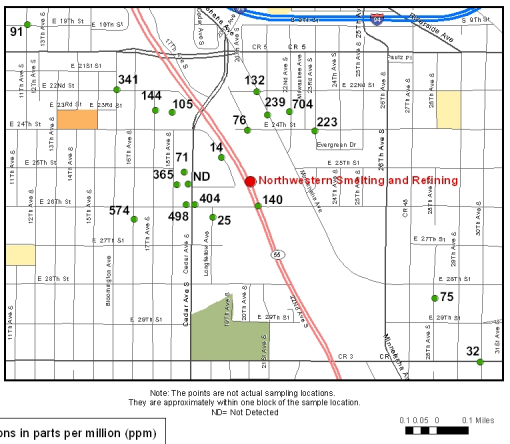
- I also did a little further study of the USAToday report. There
were smelters nearby in Cincinnati, upwind from Newport. They, too,
could have contributed to Newport's lead load.
- USAToday report tipped me off
- to this site in Cincinnati (by the way, Certified Metals also owned the Newport Foundry site at one time). P. 7 of 33 has the lead levels.
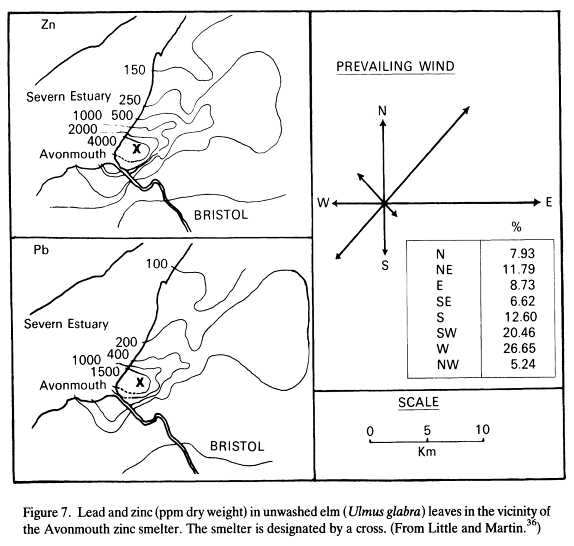
- It is important that we determine prevailing winds for Newport:
- A crack at Prevailing Winds:
I took my Newport prevailing wind info from Weatherspark.com, years 1973 to 2014.
I scrunched down the year display until I got just one wind direction for each year, and hope that that is giving me the yearly average for each year.
Each average gave a mph, and an angle direction (from due south, in a counter-clockwise sense). So 90 would mean heading due east. The result of averaging over 41 years is an average speed of 6.35 mph, and a direction of 130.69 (about 41 degrees from due east in a north-easterly direction).
- A crack at Prevailing Winds:
- Here are my preliminary analyses and results for mapping Newport
(surface) lead:
Todo:
- Discuss why we do or don't want to proceed to a map of Newport from this data (see MN study below, in Links);
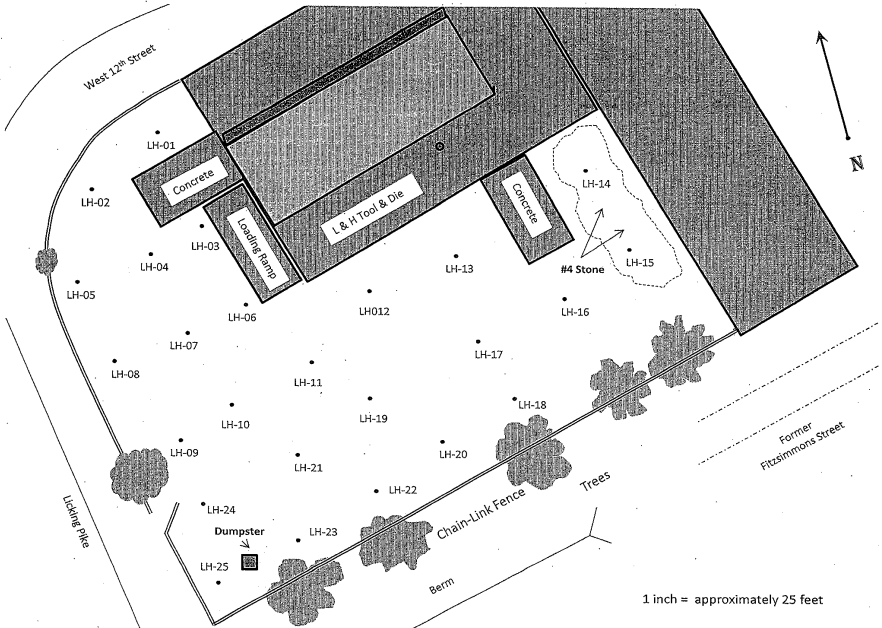
- Get surface level estimates for lead at the LH site;
- Solidify the soil profile data and model; and
- Finish the report!
- I did a search of lead pollution
patterns, and found
this interesting study and the associated graphic:
- Now it's back to figuring out how to proceed
with the proportions we're dealing with in our survey.
- Pascal's triangle is critical for
understanding proportions
- Preliminary survey results (awaiting synchronization):
All:
 (A1 Provide (a d sd sa) (27 4 5 18))
 (A2 Safe  (a d sa sd) (33 8 11 2))
 (A3 Eat/Ex (a d sa sd) (32 12 8 2))
 (A4 Someone (d a sa sd) (3 22 26 3))
 (A5 Community (a d sd sa x) (30 15 3 5 1))
 (A6 Hope (a d sa x sd) (24 3 25 1 1))
 (B Age (50 31 16 15) (13 21 15 5))
 (C Gender (m f x) (22 28 4))
 (D Newport (w e x) (29 21 4)))
Westside:((a d sa sd) (18 3 7 1)) ((a d sa sd) (19 5 4 1)) ((a d sa sd) (17 9 2 1)) ((d a sa sd) (1 16 11 1)) ((a d sd sa x) (13 7 3 5 1)) ((a d sa sd) (14 2 12 1)) ((50 31 16 15) (5 11 10 3)) ((m f x) (12 15 2)) ((w) (29)))
Eastside:((d sd sa a) (1 3 10 7)) ((d a sd sa) (3 11 1 6)) ((a d sa sd) (12 3 5 1)) ((a d sa sd) (5 1 14 1)) ((d a) (7 14)) ((d a sa x) (1 8 11 1)) ((16 31 50 15) (4 10 6 1)) ((f m x) (12 8 1)) ((e) (21)))
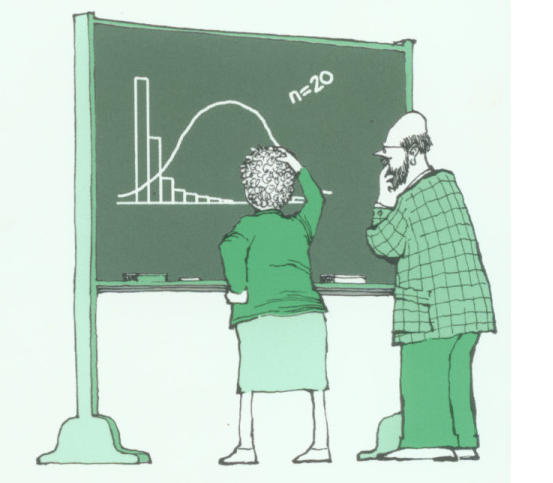
- The normal distribution: probabilities often come down to
- Transforming data to a normal distribution, then
- Computing a Z-statistic from a normal distribution:


A "Z table"
- A Z for a proportion:
- Pascal's triangle is critical for
understanding proportions

- Combined weighted pseudo-532
values, for use in xlispstat.
- Minnesota
has dealt with a similar situation (USAToday report inspired a study)
This report contains a couple of graphs which show off the data values, the way I would like to for our data. Some quotes from their study:
- Most homes in St. Paul and Minneapolis are old enough to once have had substantial concentrations of lead in exterior and interior paint. The 2000 Census documented that 89% of the homes in Minneapolis and St. Paul were built before 1978, which is the year lead was banned in residential paint. The City of Minneapolis reports that levels of 350 ppm in soil collected near house foundations are typical throughout Minneapolis. Elevated lead is also found in residential areas from past emissions of leaded gasoline, especially near busy neighborhood streets.
- There are sites in Minnesota where it has been possible to attribute lead in the soil to emissions from former lead smelters. However, in this case it would be difficult, if not impossible to attribute lead concentrations in those two residential neighborhoods to the former smelters in the USA Today story. The heterogeneity of the lead soil sampling results reported in the neighborhoods surrounding the former smelter sites suggests that the lead is likely not due to area-wide contamination from air emissions from a former smelter stack. Determining the source of lead in soil may be possible through expensive lead isotope laboratory analyses, but such a project would take time, may not produce definitive results, and would not lead to different public health conclusions and recommendations.
- Links:
- Keener, et al. have looked at lead in Newport, and done their own sampling.
- Eventually I will share this presentation that I gave to math majors at Murray State University, many years ago. Although it was given to math majors, the major ideas can be understood by anyone. Hence we will will gloss over some of the specifics, without sacrificing the big ideas.
- The USA Today website has some (limited) data which we can use for
the Newport area
(via their "dig
deeper" link). Today we want to talk about how to get at the lead
values.
But there are other things to talk about from that study.
It motivated another class in the Project Hope initiative, of which Emily Keener was a member to write the following report. Emily Keener was kind enough to tip me off to the existence of the Superfund report.
One of the students on this project went on to write the Enquirer article which just came out.
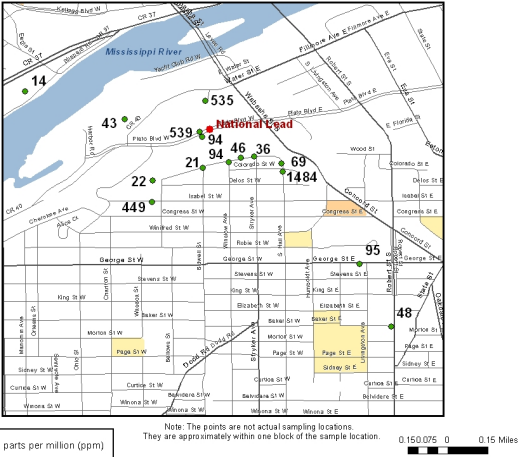
- The Superfund Final
Report (KY EPA), which examined lead levels specifically around the
smelter (Newport Foundry) is what we are currently examining.
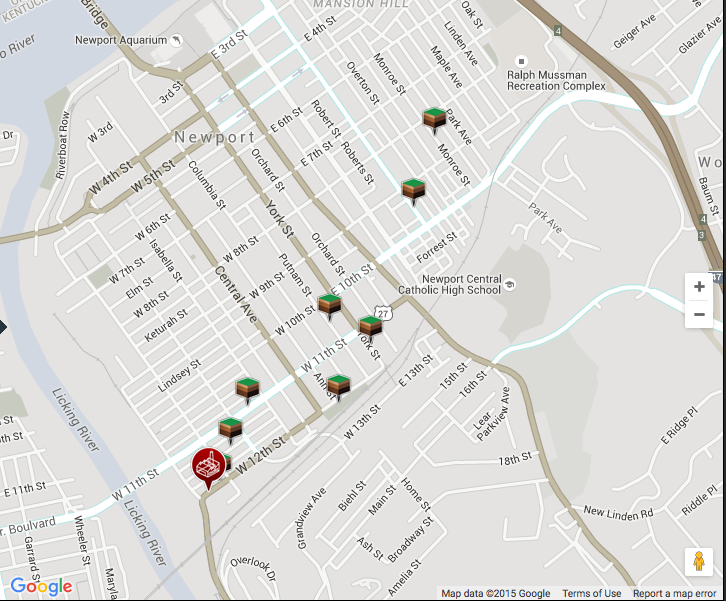
We're using the KY EPA lead data to
- map the yard around the former smelter, and determine a "lead load" in the immediate vicinity of the smelter, and to
- get a "soil lead profile" -- since we have multiple lead levels at
each site. So let's talk about this one today. It will help us to get
an answer to the previous problem.
In the end, we get results that look like these.