- Surveying finished? What's the report?
- Haley and Sandra
- Marisa and Melody
It will soon be time to begin analysis of the surveys. I'll compile the data over the weekend, and we'll hopefully have our results on Monday.
- Homework from Monday returned:
- You were to use weighted averages for the "pseudo-532" measure (weighted by weighted by population size, or housing units, or?), as we discussed in class.
- I mentioned in the assignment that owner-occupied housing is a "percentage", but some of you used the raw values.
- If you decided to resubmit your work, please hand that back in now.
- By the way, for this analysis it doesn't matter which
kinds of dollars you use for the median income -- 2013
dollars or dollars of the time. Moran's I is
insensitive to a "linear scaling".
To turn 1999 dollars into 2013 dollars, we simply multiply each dollar amount by a constant fixed number. This just scales the data -- they still have the same relative values to each other.
- I'm still holding the Wednesday homework, as I have to enter the
coordinates by hand. (This is why I'm asking you to send me things electronically!:)
- Reminder that you have homework due today and Monday:
- For today: Finish the data set of physical locations
for the USAToday sites.
Please submit these in electronic as well as paper form.
- For Monday: Submit your lead levels for the
Newport sites from the USAToday study (please
submit electronically, as well).
Then, by Monday we should have all the lead data and data locations. It will then be time to wrap up our analysis.
- There will be a talk on the lead project on Saturday, 3:15, Griffin 201, if you're interested. I'm planning on attending.
- For today: Finish the data set of physical locations
for the USAToday sites.
From these locations and samples, we seek to estimate at neighboring locations. How should one do this? This is the fundamental question which we wish to consider.
My big picture "to do" list:
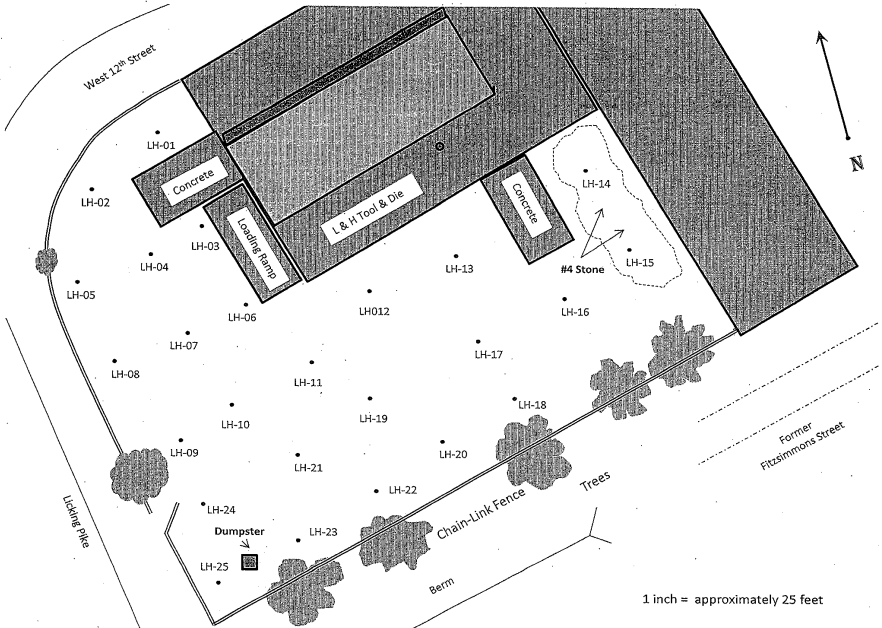
- We need to get physical coordinates for the lead data in
the vicinity of the smelter (Newport Foundry Inc) from
the EPA study. (Why is the "1 inch = approximately 25
feet" a bad idea on this map?) We need to estimate
corresponding lead levels at each location.
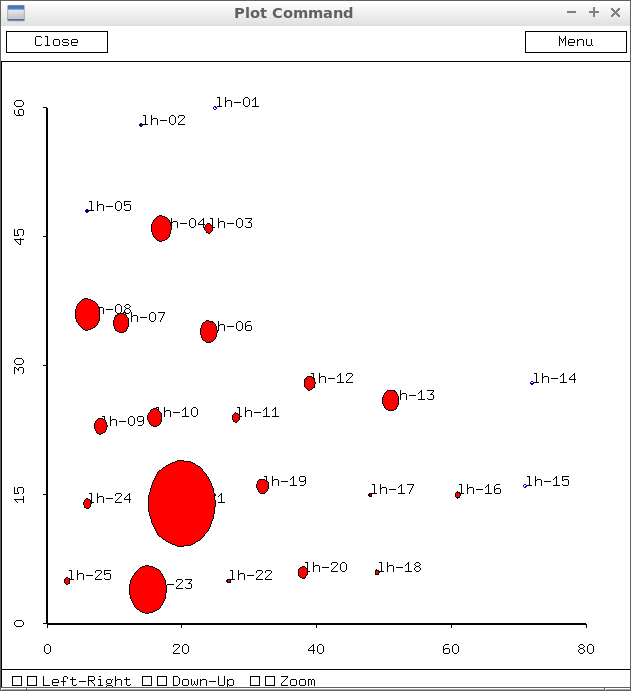
This graphic was generated using lead values from the GraceSandra method provided by Grace.
Here's what I've got by my automated procedure. There are slight differences that I've not reconciled yet. What differences do you notice?
34.5
 176.
 659.
 2138.5
 125.2
 1415.
 1263.
 2028.86
 1036.4
1163.
 622.
 905.
 1399.67
 42.6667
 73.25
 413.615
 266.
 336.75
969.
 769.
 5502.
 275.667
 3055.
 616.5
 462.75
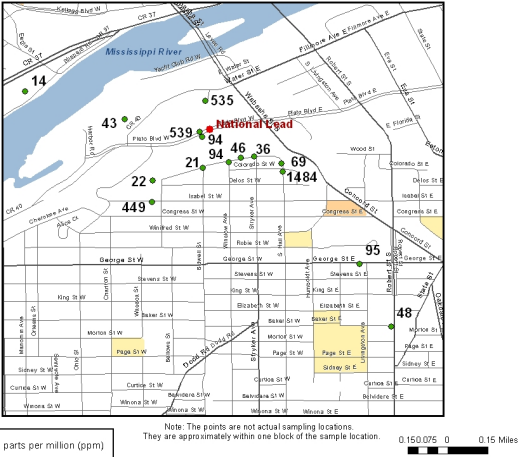
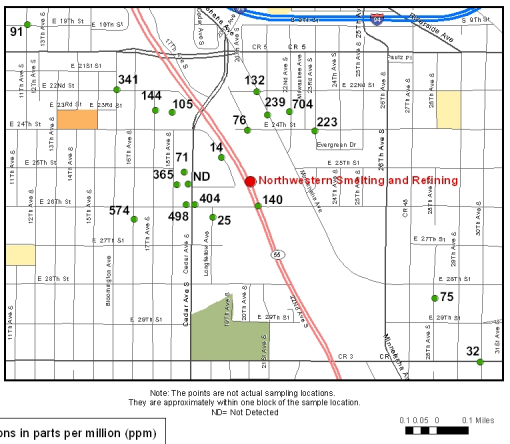
- We need to get physical coordinates for the lead data in
the Newport vicinity of the smelter from the USA Today
study. We need to estimate corresponding lead levels at
each location.
We should have those today. I've got one from Marisa
- We can construct a soil lead profile, based on the tests at different soil levels.
- We can construct distributions of lead levels in different ways (by soil depth, say, and for Newport as a whole).
- Finally we need to consolidate this into a summary report. You will either report on this problem or on the survey results for your final project.
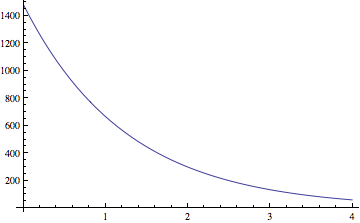
- It starts with the soil lead profile model,
Questions:
- Two proposed solutions for the site: capping with
concrete, or capping with a pile of clean soil.
What's wrong with each of those methods?
- What's our objective for remediation? What's our target?
- How can we solve this problem without going off site?
- Two proposed solutions for the site: capping with
concrete, or capping with a pile of clean soil.
- We need to think about what we expect for Newport, based on the assumption
that the smelter was the cause of lead pollution in Newport.
- I did a search of lead pollution
patterns, and found
this interesting study and the associated graphic:
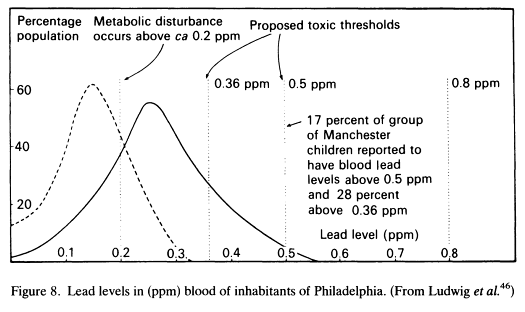
The dashed curve is suburban males; the solid curve is urban males.
- I also did a little further study of the USAToday report. There
were smelters nearby in Cincinnati, upwind from Newport. They, too,
could have contributed to Newport's lead load.
- USAToday report tipped me off
- to this site in Cincinnati (by the way, Certified Metals also owned the Newport Foundry site at one time). P. 7 of 33 has the lead levels.
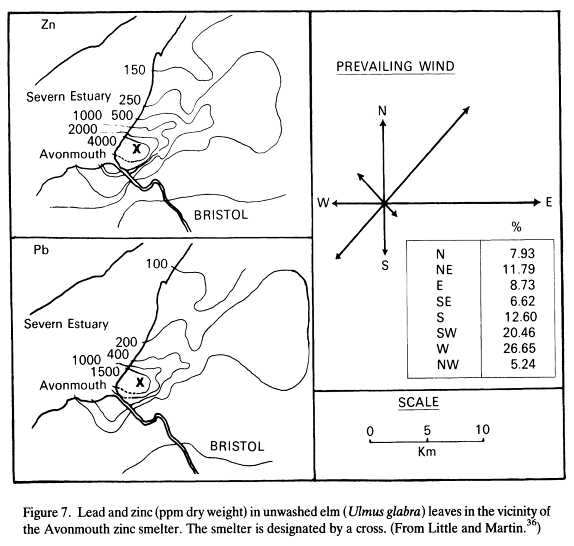
- It is important that we determine prevailing winds for Newport:
- A crack at Prevailing Winds
- I did a search of lead pollution
patterns, and found
this interesting study and the associated graphic:
- Combined weighted pseudo-532
values, for use in xlispstat.
-
- Minnesota
has dealt with a similar situation (USAToday report inspired a study)
This report contains a couple of graphs which show off the data values, the way I would like to for our data. Some quotes from their study:
- Most homes in St. Paul and Minneapolis are old enough to once have had substantial concentrations of lead in exterior and interior paint. The 2000 Census documented that 89% of the homes in Minneapolis and St. Paul were built before 1978, which is the year lead was banned in residential paint. The City of Minneapolis reports that levels of 350 ppm in soil collected near house foundations are typical throughout Minneapolis. Elevated lead is also found in residential areas from past emissions of leaded gasoline, especially near busy neighborhood streets.
- There are sites in Minnesota where it has been possible to attribute lead in the soil to emissions from former lead smelters. However, in this case it would be difficult, if not impossible to attribute lead concentrations in those two residential neighborhoods to the former smelters in the USA Today story. The heterogeneity of the lead soil sampling results reported in the neighborhoods surrounding the former smelter sites suggests that the lead is likely not due to area-wide contamination from air emissions from a former smelter stack. Determining the source of lead in soil may be possible through expensive lead isotope laboratory analyses, but such a project would take time, may not produce definitive results, and would not lead to different public health conclusions and recommendations.
- Links:
- Keener, et al. have looked at lead in Newport, and done their own sampling.
- Eventually I will share this presentation that I gave to math majors at Murray State University, many years ago. Although it was given to math majors, the major ideas can be understood by anyone. Hence we will will gloss over some of the specifics, without sacrificing the big ideas.
- The USA Today website has some (limited) data which we can use for
the Newport area
(via their "dig
deeper" link). Today we want to talk about how to get at the lead
values.
But there are other things to talk about from that study.
It motivated another class in the Project Hope initiative, of which Ellen Keener was a member to write the following report. Ellen Keener was kind enough to tip me off to the existence of the Superfund report.
One of the students on this project went on to write the Enquirer article which just came out.
- The Superfund Final
Report (KY EPA), which examined lead levels specifically around the
smelter (Newport Foundry) is what we are currently examining.
Last time we began using a grid to get coordinates for data locations we have. Try to check with your classmates, to make sure that you're getting consistent results.
We'll need to get coordinates for the USA Today study, too, so let's get some reference points for that one, too, before we go on.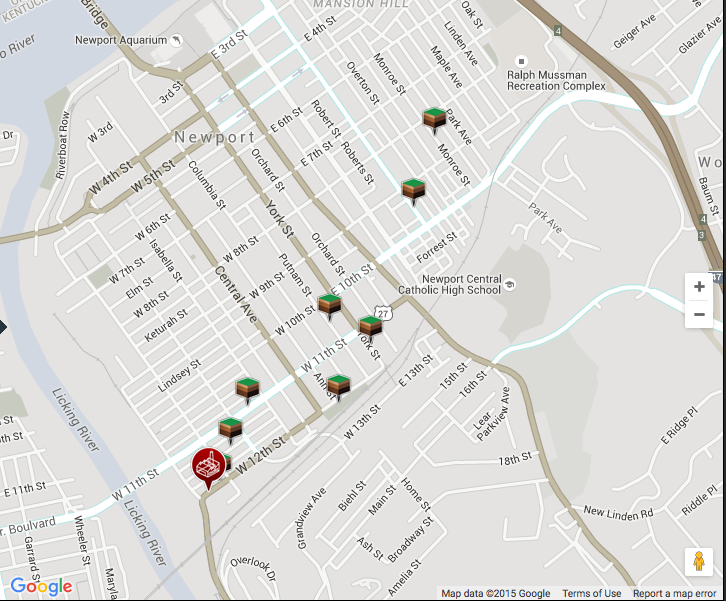
We're using the KY EPA lead data to
- map the yard around the former smelter, and determine a "lead load" in the immediate vicinity of the smelter, and to
- get a "soil lead profile" -- since we have multiple lead levels at
each site. So let's talk about this one today. It will help us to get
an answer to the previous problem.
Last time we were talking about this problem. How do we generate the soil lead values for the sites we've identified? I suggested a method for getting started: the idea was that we were going to put all our samples together into one, to get an idea of how soil lead level changes with depth. We have an idea of what to expect.
Let's think of a simple example, and see how it would work: three samples, as follows:
- Sample 1:
- 0-1: 49
- 1-2: 23
- 2-3: 17
- Sample 2:
- 0-1.5: 123
- 1.5-2.5: 90
- 3-4: 47
- Sample 3:
- 0-1: 220
- 1-3: 71
I'll now have you record the data in this way, using your sheet from the KY EPA. Take out your data sheet: we're going to mark it up.
In the end, we'll get results that look like these. Let's take a look at my work.
To do:
- Can you verify my work in that result file?
- Can you think of a better way to represent the data?
- Now: how would you estimate the lead value at each site, perhaps including this analysis? As Kensey said last time, "So there's no right answer...." -- and she is correct! There's no right answer -- there are only reasonable answers, and we could then debate how reasonable each is!
- Sample 1: