

| Fall 2020 | Fall 2021 | Fall 2022 | Fall 2023 | Fall 2024 | 3-year | Target | |
|---|---|---|---|---|---|---|---|
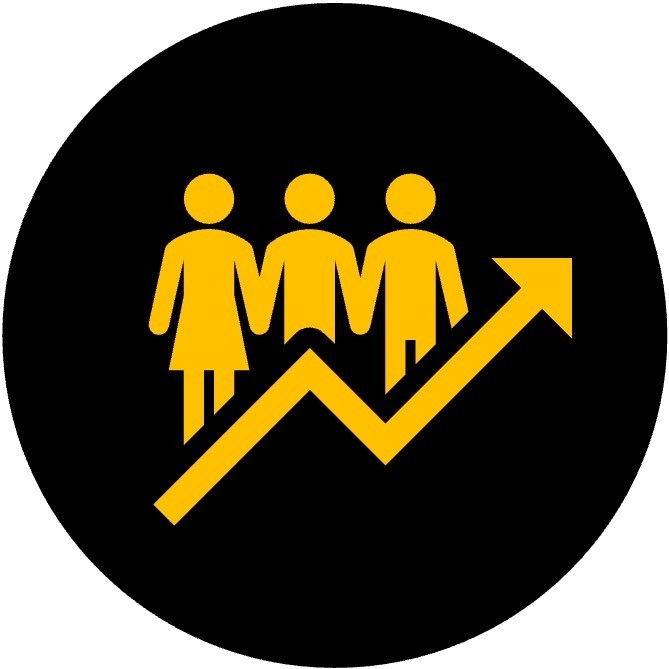
| Overall | 11,672 | 10,988 | 10,940 | 10,069 | 10,327 | -6.0% | 11,854 |
| URM | 1,632 | 1,540 | 1,547 | 1,523 | 1,667 | 8.2% | -- |
First Generation |
5,301 | 4,655 | 4,635 | 3,935 | 4,201 | -9.8% | -- |
| Low Income | 2,907 | 2,796 | 2,407 | 2,415 | 3,086 | 10.4% | -- |
| Fall 2020 | Fall 2021 | Fall 2022 | Fall 2023 | Fall 2024 | 3-Year Trend | Target | |
|---|---|---|---|---|---|---|---|
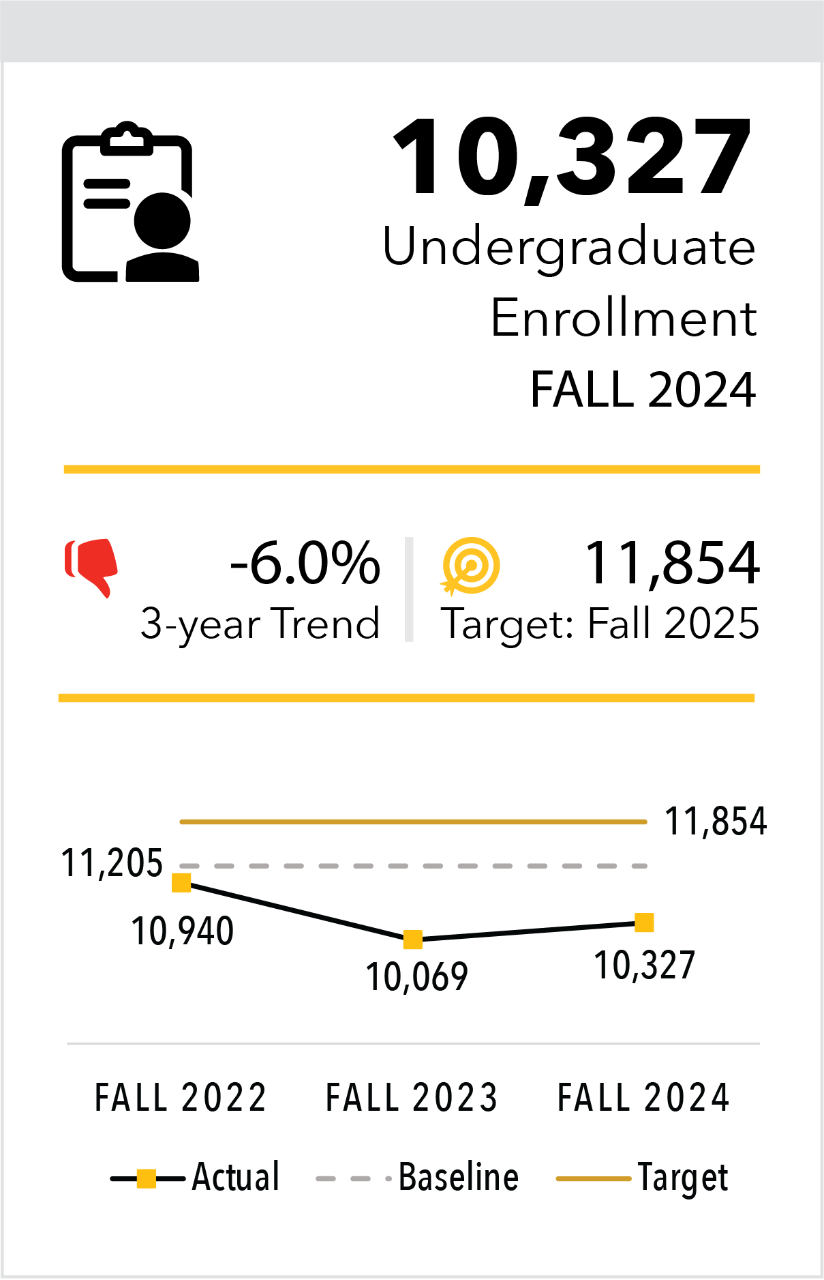
| Overall | 4,540 | 5,006 | 4,887 | 4,916 | 5,043 | 0.7% | 5,156 |
| Graduate Total | 4,147 | 4,600 | 4,523 | 4,543 | 4,655 | 1.2% | -- |
Graduate URM |
718 | 881 | 945 | 935 | 1,013 | 15.0% | -- |
| Law Total | 393 | 406 | 364 | 373 | 388 | -4.4% | -- |
| Law URM | 41 | 44 | 31 | 40 | 45 | 2.3% | -- |
| 2019-20 | 2020-21 | 2021-22 | 2022-23 | 2023-24 | 3-Year Trend | Target | |
|---|---|---|---|---|---|---|---|
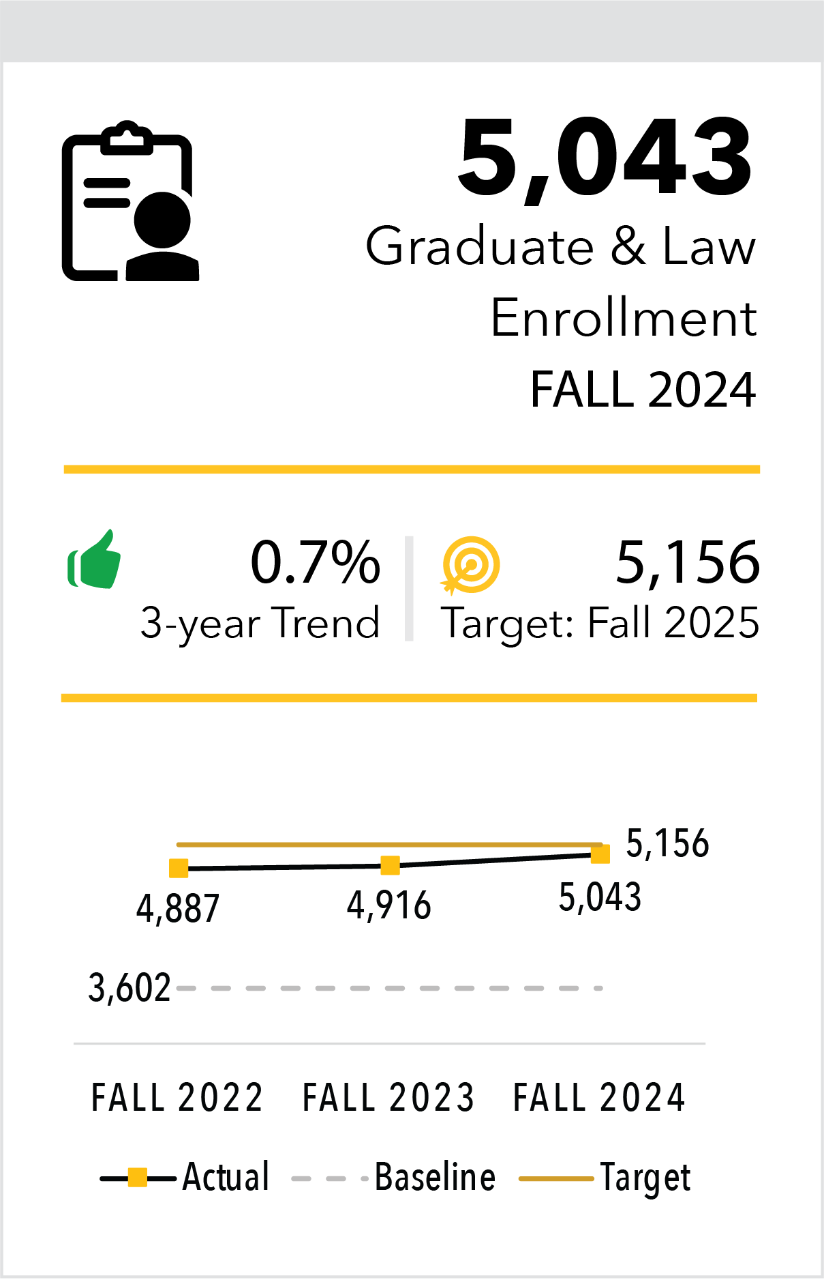
| Overall | $10,653 | $10,883 | $10,405 | $11,206 | $11,961 | 9.9% | $10,375 |
| URM | $13,215 | $13,584 | $12,142 | $14,027 | $15,002 | 10.4% | -- |
| First Generation | $12,290 | $12,920 | $12,605 | $14,279 | $14,900 | 15.3% | -- |
| Low Income | $15,666 | $16,195 | $14,242 | $16,572 | $16,930 | 4.5% | -- |
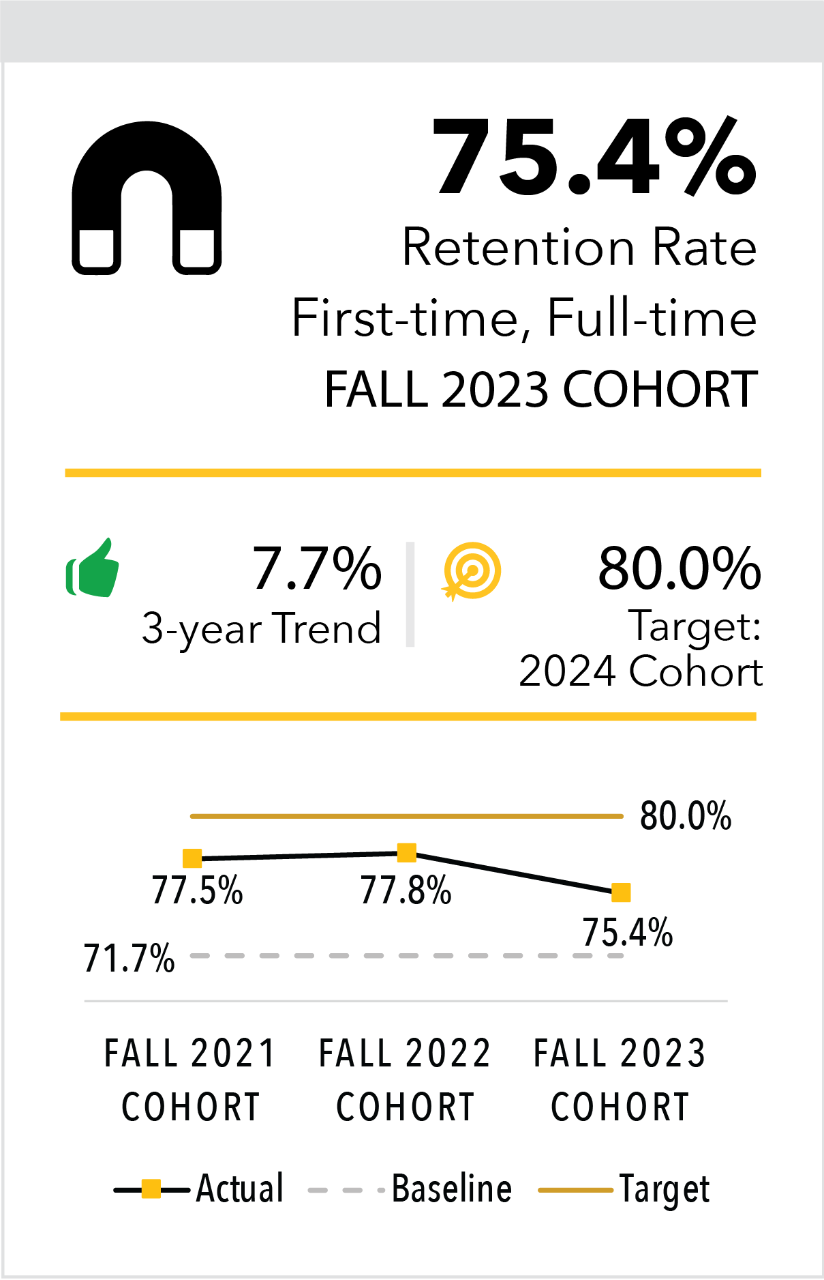
| Fall 2019 Cohort | Fall 2020 Cohort | Fall 2021 Cohort | Fall 2022 Cohort | Fall 2023 Cohort | 3-Year Trend | Target | |
|---|---|---|---|---|---|---|---|
| Overall | 74.5% | 70.0% | 77.5% | 77.8% | 75.4% | 7.7% | 80.0% |
| URM | 69.0% | 60.2% | 74.2% | 75.1% | 67.7% | 12.5% | -- |
| First Generation | 69.3% | 60.5% | 70.3% | 69.9% | 65.4% | 8.1% | -- |
Low Income |
69.1% | 61.6% | 69.0% | 74.6% | 69.9% | 13.5% | -- |
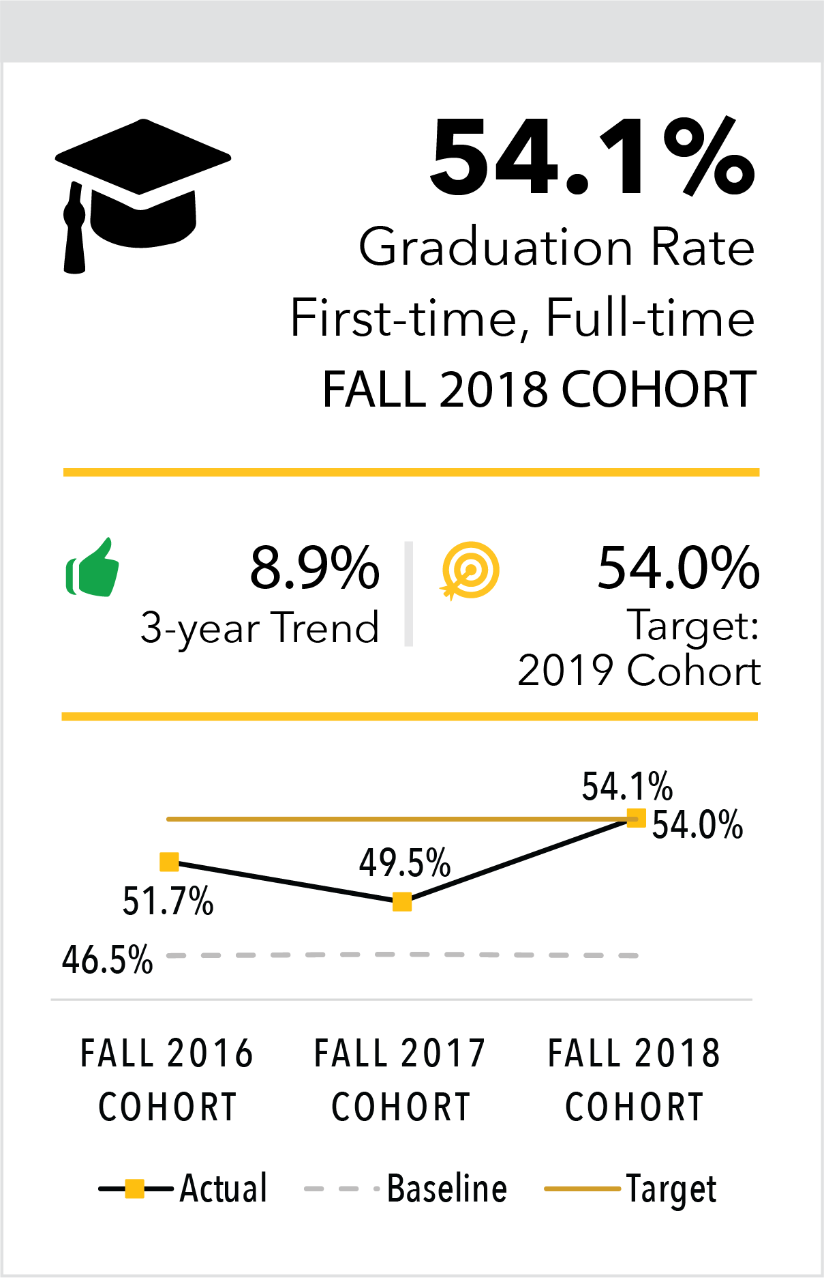
| Fall 2014 Cohort | Fall 2015 Cohort | Fall 2016 Cohort | Fall 2017 Cohort |
Fall 2018 Cohort | 3-Year Trend | Target | |
|---|---|---|---|---|---|---|---|
| Overall | 48.2% | 49.7% | 51.7% | 49.5% | 54.1% | 8.9% | 54.0% |
| URM | 39.8% | 41.1% | 43.9% | 39.3% | 46.9% | 14.1% | 45.9% |
| First Generation | 42.8% | 43.7% | 43.1% | 44.8% | 46.2% | 5.7% | 43.1% |
Low Income |
36.4% | 36.9% | 38.3% | 38.4% | 45.6% | 23.6% | 41.7% |
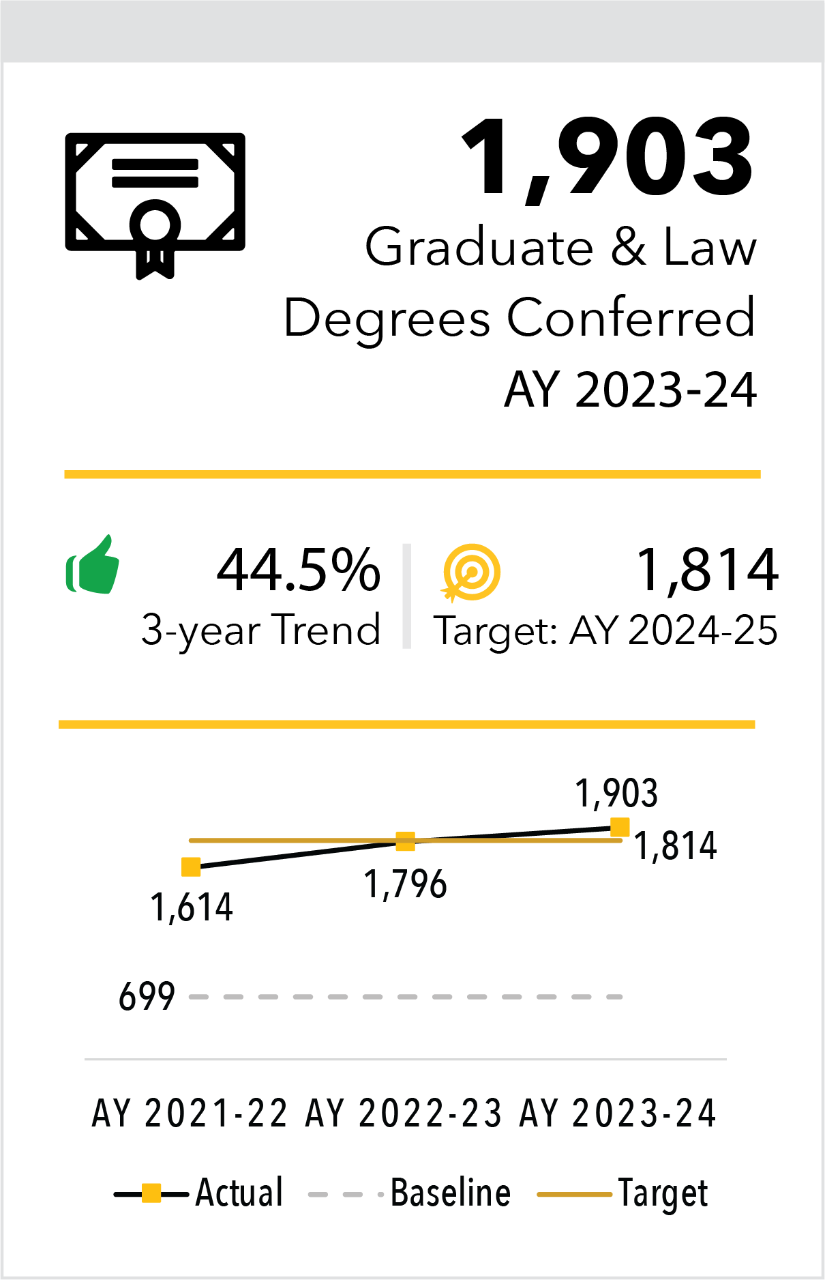
| AY 2020-21 | AY 2021-22 | AY 2022-23 | AY 2023-24 | 3-Year Trend | Target | |
|---|---|---|---|---|---|---|
| Overall | 1,317 | 1,614 | 1,796 | 1,903 | 44.5% | 1,814 |
| Graduate Total | 1,217 | 1,495 | 1,694 | 1,777 | 46.0% | -- |
| Graduate URM | 171 | 235 | 332 | 334 | 95.3% | -- |
Law Total |
100 | 119 | 102 | 126 | 26.0% | -- |
| Law URM | 8 | 14 | 5 | 15 | 87.5% | -- |


| Spring 2018 | Spring 2022 | 4-Year Trend | |
|---|---|---|---|
| Participated in at least one | 84.0% | 92.0% | 9.5% |
| Participated in two or more | 57.0% | 68.0% | 19.3% |
| Out-of-state Employment | In-state Employment | Total Employed | |
|---|---|---|---|
| 1-year Post Completion | 41.0% | 41.0% | 82.0% |
| 3-years Post Completion | 41.0% | 37.0% | 78.0% |