| Interpreting a Standard Curve
A spectrophotometer measures light quantity. It tells you how much light is passing through a solution (transmittance) or how much light is being absorbed by a solution (absorbance).
If you graph absorbance versus concentration for a series of known solutions, the line, or standard curve, which fits to your points can be used to figure out the concentrations of an unknown solution. Absorbance, the dependent variable, is placed on the y-axis (the vertical axis). Concentration, the independent variable (because it was set by you when setting up the experiment), is graphed on the x-axis. When you measure the absorbance of an unknown sample, find that y-value on the standard curve. Then trace downward to see which concentration matches up to it. Mouse over the graph below to see an example of this.
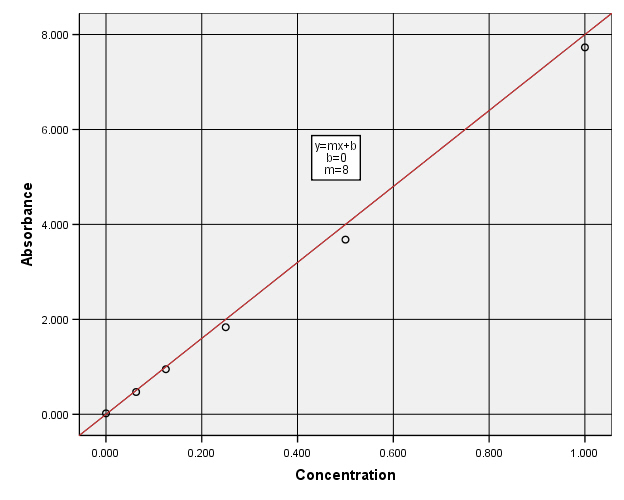
Below is a standard curve generated from absorbance data similar to what we generated in class. Notice that as concentration increases, absorbance increases as well. While you can estimate concentration of an unknown from just looking at the graph, a more accurate way to determine concentration to actually use the equation of the line which fits to your data points. This equation is given in the y-intercept form: y=mx+b
where
m is the slope of the line and b is the y-intercept (where the line touches the y-axis).
The equation y=mx+b can be translated here as "absorbance equals slope times concentration plus the y-intercept absorbance value." The slope and the y-intercept are provided to you when the computer fits a line to your standard curve data. The absorbance (or y) is what you measure from your unknown. So, all you have to do is pop those three numbers into the equation and solve for x (concentration).
An example: your unknown's absorbance (y) is 6.00
Based on the curve below, slope (m) = 8 and b=0
if y=mx+b
then 6.00 = 8*x + 0
and 6/8=x
and
0.75=x
so the concentration of the unknown would be 75% the original stock, which was 100 ug/ml. 75% of 100 ug/ml = 75 ug/ml concentration.
The units on the graph below are absorbance (y) versus the dilution factor (x) of each solution used (0=water to 1=undiluted stock).
|