Quadratic Functions
Basics
|
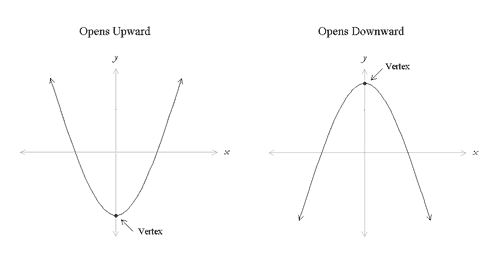
Definition and Symbolic Representation Quadratic functions can be represented symbolically by the equation, y(x) = ax2 + bx + c, where a, b, and c are constants, and a ≠ 0. This form is referred to as standard form. The coefficient a in this form is called the leading coefficient because it is associated with the highest power of x (i.e. the squared term). Graphical Representation Quadratic functions are nonlinear functions that are graphically represented by parabolas. Parabolas have a characteristic ∪-shape and open either upward or downward as shown below,
A few things to notice about these graphs:
Standard form provides clues to what the graph of a quadratic function will look like. By inspecting a quadratic equation in standard form, y(x) = ax2 + bx + c, you can get an idea of what the graph will look like. The leading coefficient tells you the direction the parabola opens, specifically
In addition, the constant c is the y-intercept of the quadratic function. This fact can be derived mathematically by setting x = 0 (remember, points lying on the y-axis must have x-coordinate equal to zero) in the standard form of a quadratic equation yielding, y(0) = a · 02 + b · 0 + c y(0) = c. Note that a quadratic function will always intersect the y-axis, but may not intersect the x-axis (we will discuss this topic in more detail later). Finally, by inspecting the standard form of a quadratic equation, you can see that the domain of quadratic functions is all real numbers (i.e. there is no value of x that cannot be substituted into the equation y(x) = ax2 + bx + c). The range of quadratic functions, however, is not all real numbers, but rather varies according to the shape of the curve. Specifically,
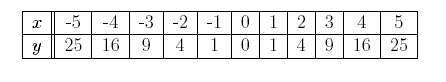
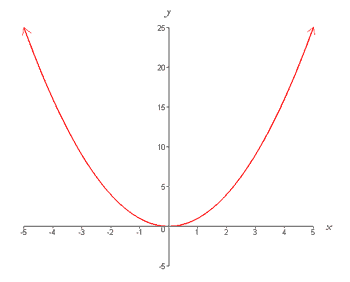
An example The simplest quadratic function is given by y = x2. To graph this function by hand, you can use a table of values as follows, By inspecting this table of values, you can see that the functional values are symmetric about the vertical line x = 0. You can plot these points in the xy-plane, and draw a smooth curve through them to form a parabola as below,
***** In the next section we explore how to find the vertex of a parabola. |
The Biology Project > Biomath > Quadratic Functions > Basics
Department of Biochemistry and Molecular Biophysics
The University of Arizona
January 2006
Contact the Development Team
http://www.biology.arizona.edu
All contents copyright © 2006. All rights reserved.