Functions
Properties of Functions
|
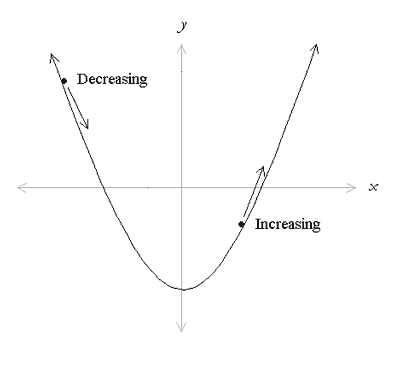
This section will introduce a few terms to qualify functions. Understanding these properties comes in handy when you are sketching graphs of functions or looking at what happens when a given quantity is maximized or minimized. Increasing and Decreasing Functions Imagine you are observing how a certain property of a biological system is changing over time. Mathematically, you would be looking at whether or not the function modeling the property increases or decreases. To determine whether a function is increasing or decreasing we must “read” the graph of the function from left to right. You can think of an increasing function as one that rises from left to right, and a decreasing function as on that falls from left to right. Most functions do not increase/decrease for all x in the domain, but rather, they increase on some intervals and decrease on others. We say that f increases on some interval, I if for x1 and x2 in I,
On the other hand, we say that f decreases on I if for x1 and x2 in I,
To determine if the graph of a function increases or decreases over a specified interval, we read the graph left to right and determine whether it has an upward or downward trend as pictured below,
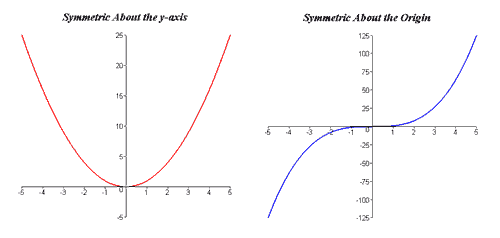
If you imagine a ball rolling on the graph, the ball will be rolling downhill on portions of the graph that decrease, and it will be rolling uphill on portions of the graph that increase. Odd and Even Functions Some functions have the special property of being odd or even. Odd and even functions have special graphical symmetries.
How do we know if a function is odd? An example of an odd function is f(x) = x. We can demonstrate that f(x) = x is odd by showing that f(−x) = −f(x) by substituting -x for x as, f(−x) = −x = −f(x). If a function is not odd, it might (but not necessarily) be even.
An example of an even function is f(x) = x2. We can demonstrate that f(x) = x2 is even by showing that f(-x) = f(x) as, f(-x) = (- x2) = (−1)2x2 = x2 = f(x). As stated above, the graphs of odd and even functions each have special symmetries. The graph of an odd function is symmetric about the origin. A graph is symmetric about the origin if the point (-x, -y) lies on the graph whenever (x, y) does. The graph of an even function, on the other hand, is symmetric about the y-axis. A graph is symmetric about the y-axis if the point (-x, y) lies on the graph whenever (x, y) does.
Not all functions are classified as odd or even; a function that is not even or odd is called neither.
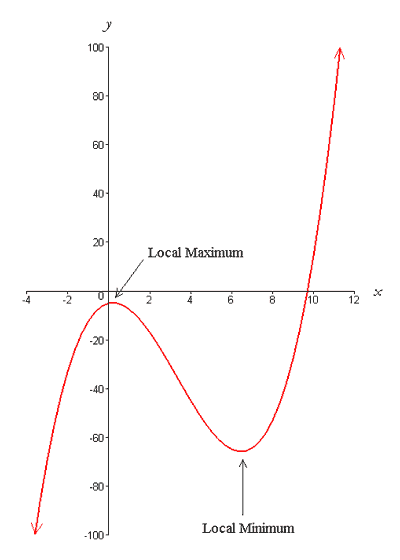
An example of a function that is neither even nor odd is f(x) = x + 1. We can demonstrate this by finding f(−x) as, f(−x) = −x + 1. Notice that f(−x) is not equal to −f(x), because −f(x) = −(x + 1) = −x−1; and f(−x) is not equal to f(x) , because f(x) =x + 1. The fact that even and odd functions have certain graphical symmetries is useful to know. In particular, if you know some function f(x) is odd (even) and know the value of f(a), then you also know that the value of f(−a) is −f(a) (f(a)). Similarly, if you know some function f(x) is even and know the value of f(a), then you also know that the value of f(−a) is −f(a). This becomes important when you study integral calculus because the integral of an odd or even function over a symmetric interval can be greatly simplified. Maxima and Minima of Functions A function may achieve values that can be classified as maxima and/or minima. Collectively, maxima and minima are referred to as extrema. Graphically, you can think of maxima and minima as the functional values of peaks and valleys. Extrema may be classified as global or local. As the names imply, a global maximum is the maximum value a function achieves, while the global minimum is the minimum value a function achieves. If a function is bounded and has domain consisting of the entire real line, the global maximum is the highest peak and the global minimum is the lowest valley. Both the maximum and minimum of a function must be a finite number. Therefore, if a function increases without bound, that function has no global maximum. Likewise, if a function decreases without bound, there is no global minimum. However, these unbounded functions can have local maxima and minima, as shown in the figure below,
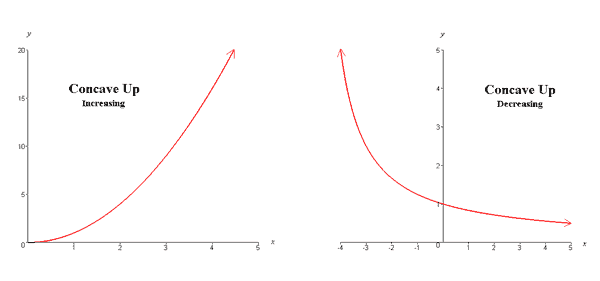
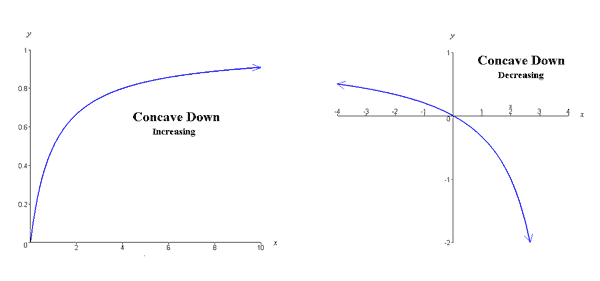
The extrema depicted in the above graph are local because the function increases and decreases without bound as indicated by the arrows on the graph. Concave Up and Concave Down Functions
In the next section we will learn how to add, subtract, multiply, and divide functions. |
The Biology Project > Biomath > Functions > Properties
Department of Biochemistry and Molecular Biophysics
The University of Arizona
January 2006
Contact the Development Team
http://www.biology.arizona.edu
All contents copyright © 2006. All rights reserved.

