Functions
Function Representations
|
You are probably most familiar with the symbolic representation of functions, such as the equation, y = f(x).
Functions can be represented by tables, symbols, or graphs. Each of these representations has its advantages. Tables explicitly supply the functional values of specific inputs. Symbolic representation compactly state how to compute functional values. Graphs provide a visual representation of a function, showing how the function changes over a range of inputs . Tables Tables provide an easy means to compare the inputs and output of a given function. A complete table, listing all inputs and outputs, can only be used when there are a small number of inputs and outputs. A partial table can be used to list a few select inputs and outputs. This type of table often indicates the shape of the function, or indicates the pattern for generating the outputs from the inputs. Complete tables can tell you if a given relation is a function or not. Consider the following complete table,
By inspection, we can see that the above table represents a function because each input corresponds to exactly one output. Do not be alarmed that the output y = −2 is listed twice. The fact that two different inputs gives rise to the same output does not violate the definition of a function. The table below, on the other hand, does not represent a function,
In this case, the input x = 3 gives rise to two different outputs, y = 1 and y = −1. This is also true for input x = 1 which corresponds to outputs y = 2 and y = −3. . Symbolic Representation Functions are commonly represented symbolically because these representations are compact. An example of a symbolic representation is f(x) = y = 2x. In this case, we multiply each input x by 2 to get the corresponding output y. Another example of a symbolic representation is g(x) = x2 +1. In this case, we take each input x, square it, and then add one. How do you know if a given equation represents a function? Not all equations are symbolic representations of functions. For example, consider the following equation, y2 = x. Is y a function of x in the above equation? To determine if y is a function of x, it is convenient to solve for y as,
Now it is clear that y is not a function of x because for each valid input x (except x = 0), there are two outputs. For example, the input x = 4 results in the outputs Graphs We will now explore graphical representations of functions. A graph is a way to visualize ordered pairs, (x, y), on a set of coordinate axes (the xy-plane). We will begin by showing the graphical representation of the function represented in the table, We can draw the graph of this function by plotting the ordered pairs listed in the above table (i.e. (−3, 1), (−2,−2), (−1, 2), (0, 4), (1,−3), (2,−2), (3,−1)) as,
Notice that we do not connect the points because the table only gives us functional values of particular points. We do not know the functional values in between two points, such as x = −3 and x = −2. Therefore, we must assume that the function is not defined at these points. Even though we do not connect the points on the graph, it still represents a function because each input corresponds to exactly one output. If we graph the points in the table,
we have the following graph,
Clearly, this graph indicates the assignment of multiple outputs to the inputs x = 1 and x = 3, and therefore does not represent a function. This example illustrates how graphs are a convenient way to represent relations because one can easily test whether or not a particular graph represents a function. If a graph represents a function then it will pass the vertical line test, which states that a set of points represents a function if and only if no vertical line intersects the graph at more than one point. This makes sense, because if an input, x, is assigned to exactly one output, y, then a vertical line, which corresponds to a single value of x will intersect the graph at only one point. If, on the other hand,a vertical line intersects the graph of f in more than one place, then f is not a function and fails the vertical line test. Using the vertical line test we can see that the previous graph does not represent a function,
Representing the Domain and Range of a Function We will now look at two ways to visualize the domain and range of a function. We will begin with the following diagram of domain and range,
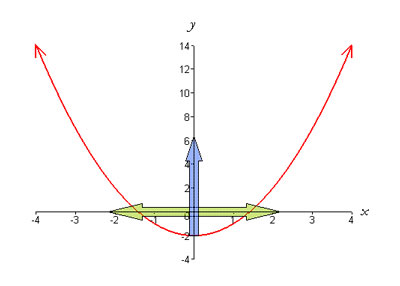
As you can see, the points in the set on the left hand side, the domain, are mapped by the function to points in the set on the right hand side, the range. That is, the inputs in the domain are mapped by f to the outputs in the range. We can visualize the domain and range of a function graphically as follows,
The red arrows on the graph indicate that the graph extends out to infinity. The green arrows show the domain as being the entire real line (i.e. all real numbers or (-∞, ∞)). The blue arrow shows the range of the function as being ( −2,∞). Not all functions have domains that consist of all real numbers. Many functions are defined in such a way that certain inputs cannot be accepted. For instance, x = 0 is not in the domain of the function
because division by zero is an undefined operation. All other inputs are valid because division is defined for all real numbers except zero, and thus we write the domain as
As we explore the different functions individually, we will learn about their domains and ranges.
In the next section we will describe some of the properties of functions. |
The Biology Project > Biomath > Functions > Function Representations
Department of Biochemistry and Molecular Biophysics
The University of Arizona
January 2006
Contact the Development Team
http://www.biology.arizona.edu
All contents copyright © 2006. All rights reserved.