- The final is next Monday, December 7, from 8:00 to 10:00. I had
the wrong time and day on the website -- sorry for any confusion!
Recall that our final exam will be split into two parts: short presentations of our reports (one hour), followed by the written exam (one hour of mathematics).
You should be working on your final reports, and you should be preparing a 6-minute presentation.
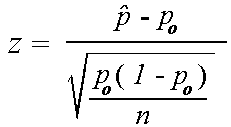
- For Wednesday: Please do the z-calculations given the proportions
in the BCC report (which we will go over in a moment). You should show
how to compute the z-values: we'll talk about it more in a moment.
- Once we get the Survey results squared away, I'll turn it over to you, to ask any questions you may have about the details you'll need as you write up your reports.
Their report tipped me off to a problem in our proportion calculations. So I did my own calculations, and the BCC was right (not too surprising there). One thing that we missed in class was that there was a missing response for one of the questions on one survey.
I did, however, note a couple of what I perceive to be errors in their calculations. See if you can find them!
- Mr. Mark Neikirk, executive director of the Scripps Howard Center for Civic Engagement at Northern Kentucky University, gave us our charge.
- We took a peek at Census tract 505, comparing census info on 505 with neighboring tracts. Our impression is that, while it's tough there, there are other tough census tracts (on the west side).
- We met with Monica Remmy at Sis's. She gave us some advice about problems in Newport, and introduced us to the lead problem in Newport.
- We reviewed other projects that have gone before, and received some advice about how to proceed (or rather, perhaps how not to proceed). Intervention seemed like an idea whose time had not yet come.
- Having discussed hope, we realized that we'd have difficulty quantifying it.
- So we settled on a survey of "well-being," instead of hope.
- We carefully planned out our survey. We proposed questions, we analyzed each others' work, and before long, we had a decent survey, and a plan for doing the survey.
- Meanwhile, we undertook some mathematics to distinguish the westside from the eastside -- graphs, in particular. Matrices then became a part of our project, as we used them to represent adjacency.
- Moran's I is a tool that we studied (and computed), to determine
if values are spatially related. We used a web tool, to demonstrate
that checkerboard (highly contrasting) patterns produce negative values
of Moran's I, and clusters of like values produce positive values. We
then applied this tool in Newport, to see if we found that census
values clustered for the Census tracts of Newport (westside versus
eastside).
We didn't find any particular clustering, but were hampered a bit by a census combination of two tracts -- clearly different (one significantly poorer than the other) -- into one.
- We then pursued lead issues. We carried out quite a few analyses
for lead, given that we had two data sets. We talked about how we might
use both of these data sets to estimate the lead problem in Newport,
and we came up with an important notion (the "soil lead profile"),
which allowed us to even propose a solution (of sorts).
While we find a problem with lead in Newport, we are unable to pin it on the smelter at this point. Our results suggest that lead values are rather randomly dispersed about the city, and cannot be tied to distance from the smelter (which one would suspect, assuming wind-borne deposition). We don't have much data far from the smelter, however.
Even on the smelter grounds, we don't see any correlation in lead values over space. A Moran's I calculation didn't show any positive spatial correlation in the lead values.
- We've been working on proportions for the analysis of our survey data in recent days. We used differences in proportions to try to detect a difference. While it appears that the westside is leaning a little less well in our survey, small numbers of surveys hampered our efforts to detect a statistically significant difference in proportions at the 0.05 level.
- The data
- Now it's back to figuring out how to proceed
with the proportions we're dealing with in our survey.
- In our second test, Pascal's
triangle is critical for understanding proportions.
- The normal distribution: probabilities often come down to
- Transforming data to a normal distribution, then
- Computing a Z-statistic from a normal distribution:

A "Z table"
- A Z for a proportion:
