- Don't forget: you have a test Friday.
- We are GO for Friday. I've heard from the athletic director, and he's actually excited about this, and willing to help. I sent him the protocol and the survey questions, so he knows what we're doing.
The weather is forecast to be nice!
- We do need to think about who will be there (and we'd like six):
so far we have those who can be (I believe: correct me if I'm wrong!),
- Kensey
- Robin
- Emily
- Alli
- Grace
- Marisa
- Sandra
- Melody
- Betsy
- Haley
- Kara
Let's spend a few minutes talking logistics:
- What do I need to bring?
- What do you need to bring?
- Now let's take a moment for your reflections on our procedure: does everything seem to be in order?
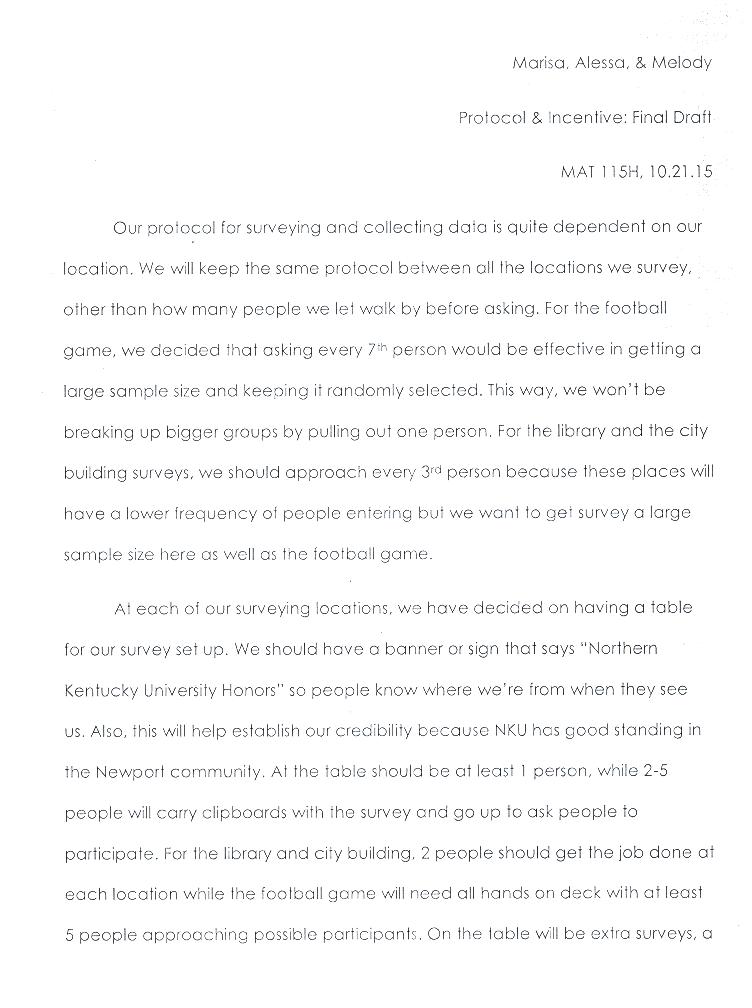
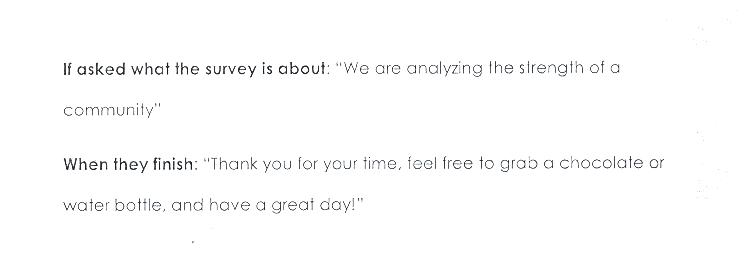
Protocol has provided a script, along with additional information:
- The final survey is available, including alternate wording.
- For Wednesday, please just proof each of these, and
- We do need to think about who will be there (and we'd like six):
- I promised that I'd start with any questions about anything we've
done in a mathematical vein up to now. What questions do you have?
- Once we're done with the questions, we'll continue to discuss how
to compute past Moran's Is for one variable in Newport (median income),
for the case where the tracts have changed over time. These data can be
obtained using Census
Explorer.
Last time we found "pseudo 532" values by creating weighted averages of the census values for 2000 and 1990. We noticed some population patterns while doing so. Populations had plummeted from 1990 to 2000, which probably led to 502 and 503 being combined into a single census tract.
Once we know how to do that, I'll turn you loose to collect some more data so that we can compute a few more Moran's Is for Newport, including over time.
- Moran's I

In the case of Newport, the median incomes look like this (for 2013 ACS):
 19779 ;; 501
 51071 ;; 504
 28507 ;; 505
 24538 ;; 506
 37917 ;; 524
 55711 ;; 525
 37772 ;; 532
 0 0 0 1 0 0 1 ;; 501
 0 0 1 0 1 0 1 ;; 504
 0 1 0 1 1 1 1 ;; 505
 1 0 1 0 0 1 0 ;; 506
 0 1 1 0 0 1 0 ;; 524
 0 0 1 1 1 0 0 ;; 525
 1 1 1 0 0 0 0 ;; 532
- Some sample calculations of MI for Newport Median Income
- In doing calculations for this data, I observed something about the adjacency graph: it's got some symmetry in it (that Moran's I won't be able to detect). Let's take a look at that, and for our example Moran's I case on the 2x2 square.
- So how do we proceed for earlier years, when census tracts 501 and 502 merge into 532? How can we compare over time? What data would we use for 2000 and 1990? Let's decide, and compute some Moran's Is.
- There are patterns that Moran's I can, and can't
distinguish.
The pattern that we'd like to be able to distinguish is called the null hypothesis. Often we want to detect departures from spatial randomness. If that is the case, as you can see from the distribution, we can't do that -- the MI for the data is right in the middle. On the other hand, we are really interested in detecting if there is something different about the west side, so we might decide which census tracts make up the west side, and then look for departures from an east side/west side split.
- Use a map (e.g. census explorer) to classify east and west side tracts
- Compute a Moran's I for a 1/0 pattern based off of those
- Then we'll look for departures from that.
Let's turn our attention back to the simpler case of the 2x2 example, but using different data.
Compute Moran's I for the data
- [1,0,0,-1],
- [1,1,-1,-1], and
- [-1,1,1,-1]
0 1 1 0
1 0 0 1
1 0 0 1
0 1 1 0
- Moran's I
- Links:
Website maintained by Andy Long. Comments appreciated.