 |
In 1979 two of eight water wells serving Woburn, MA, USA were found to be polluted (wells G and H): |
|
|
In 1979 two of eight water wells serving Woburn, MA, USA were found to be polluted (wells G and H): |
|
|
| Even before the wells had been closed, a cancer cluster alarm had been sounded by townspeople, including Anne Anderson - at right - who identified what they perceived to be an excessively high rate of leukemia (see the map below). This map shows "the proximity of the Plaintiffs' [e.g. leukemia victim] homes, wells G & H, and the locations of the Riley Tannery (R), UniFirst Properties (U), and the Cryovac Plant (C) operated by W.R. Grace", and provided the motivation for Anderson and others to file a lawsuit (made famous in the film "A Civil Action") against the owners of the industrial sites. |  [Regional Review (1992)] |
 The town was subsequently found to have an elevated rate of leukemia, and a study was carried out to determine if this elevated rate (and rates of other disorders) could be correlated to these contaminated wells. 
[Images from the collection of Professor Scott Bair, Ohio State University.] |
|
Lagakos et al. found that, indeed, the wells were implicated in several diseases in the town, including childhood leukemia. They obtained crucial exposure data from a prior study which characterized the exposure of various neighborhoods to the water from wells G and H by using water system parameters (e.g. pipe diameters, flow rates, etc.).
Lagakos et al. reached their conclusions using proportional hazards modeling. They estimated exposures (to the waters of the wells), calculated observed rates of disease versus expected, and found statistically significant increases of leukemia and several other disorders as a function of increasing exposure to the contaminated water. Their paper generated a significant amount of commentary, including issues of multiple testing, the validity of normal approximations, and confounding (of course!).
Murphy describes the course of events leading up to the study this way: "Various studies ... of the health of the people of Woburn indicate that part of the city had a higher incidence of certain childhood illnesses, including lymphocytic leukemia, than would normally be expected. The affected part of Woburn roughly coincided with the area served by the two contaminated wells. The water distribution system of Woburn was analyzed by Helen A. Waldorf and Robert K. Cleary of the New England Interstate Water Pollution Control Commission. Based on their 1984 report..., a 1986 journal article... by Lagakos, Wessen, and Zelen has reported that the rates of childhood illness have a statistically significant positive association with the use of water from the two contaminated wells. A second water distribution analysis..., made by the author to evaluate and complement the study of Waldorf and Cleary, concurred with their overall assessment."
The case (begun 5/14/82) brought by the Plaintiffs was interesting from the legal perspective, as it included issues of science in the courtroom and "Polyfurcation" of complex trials (the case was divided up into sections: in order for the plaintiffs to win, they had to "win" every stage). In fact, "The actual Woburn trial only got through one of three scheduled stages before settlement. The jury ruled that the plaintiffs had no claim against Beatrice Foods, Inc., but could proceed with their case against W.R. Grace.... W.R. Grace then settled for $8 million." (source)
The EPA settled with the polluters in 1990.
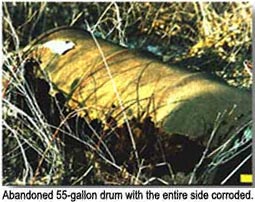
The NUS Corporation, contractor to the EPA, found that
trichloroethylene-tainted soil existed on the Grace property (creating a
northeastern plume of groundwater pollution); the Unifirst property, which
is adjacent to Grace (creating a northern plume, including
trichloroethylene); and the Wildwood (formerly Riley) property (creating a
western plume of groundwater contamination).
[Source: EPA Executive Summary on http://research.et.byu.edu/woburn/nus_docs/tocxsum.pdf]
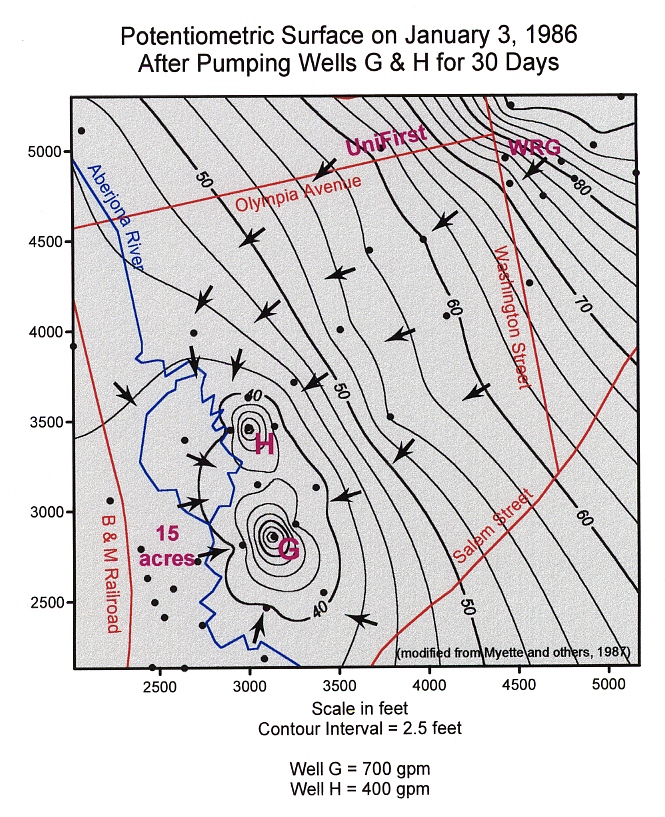
Essential arguments were presented by hydrologists and geologists, who helped determine exposure (and create exposure models).
This contour map shows the flow of water into wells G and H after 30 days of sustained pumping. The point is that contamination from WRG or UniFirst will clearly seep into the wells.
Geologists argued for both sides of the case, over such things as the Surficial Geologic Map of the Aberjona River Valley. Types of soil and rock filter water in differing ways, so both sides hoped to show how existing conditions bolster their argument.
The EPA touts the Woburn story as one of its success stories. The health of the population of Woburn continues to be monitored, culminating most recently in the Woburn Childhood Leukemia Follow-up Study, which issued its final report (volume I) in 1997.
According to Waller et al., the Woburn case "prompted the Department of Health in the neighboring state of New York in the summer of 1986 to initiate a series of meetings of statisticians, epidemiologists, and public health officials to discuss policy regarding the monitoring of the geographical distribution of cancer cases in their state." In fact, a modern upsurge in interest in spatial statistics in public health may be said to date from this case.
Furthermore, this example shows that an epidemiologist may need to go far outside of her or his expertise (to hydrology, geology, and beyond) to create sensible exposures.
Some sample documents available: