|
|
|
Population Genetics
Below is a review of the various population genetics models covered in lab. |
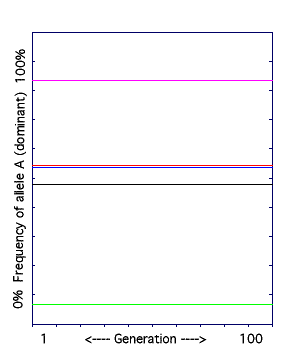 |
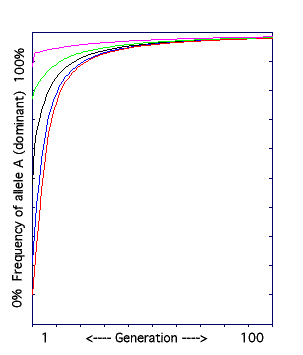
A. The Hardy-Weinberg Model.
The frequency of the dominant allele (A) in a population is graphed over 100 generations. The following rules are in effect: the population is large, there is no migration of individuals, mating is random, there is no natural selection, and no mutation.
The result: there is no change in allele frequencies over time. The model was run five times (see the different colored lines) and each time, the allele frequency at the first generation equals the allele frequency at the last generation.
This does not mean that genotype frequencies can't change over time. For example, consider two small populations, each with two individuals. Population 1: AA and aa. Population 2: Aa and Aa. The genotypes of the individuals in the populations are different, but the allele frequencies are the same in both populations: 50% A and 50% a.
|
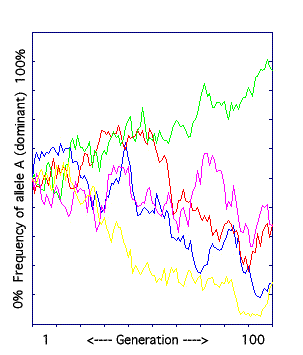 |
B. The Genetic Drift Model.
The frequency of the dominant allele in a small population (less than 100 individuals) is graphed over 100 generations.
Genetic drift is change in allele frequencies due to random events. It most strongly effects small populations. Consider two populations, each with 50% genotype AA and 50% aa. Population C has two individuals while Population D has 5000. An aa individual in each population dies. In Population C the allele frequencies change from 50% A and 50% a to 100% A, while in Population D there is almost no change in frequencies.
The result: allele frequencies change randomly (and unpredictably) over time. The model was run five times, always starting with the same allele frequency. The final allele frequency was always different, though sometimes higher and sometimes lower than at the start. |
 |
C. The Natural Selection Model I: dominant allele favored.
The frequency of the dominant allele is graphed over 100 generations. The dominant phenotype is selected for.
In natural selection, having a certain trait makes an individual more reproductively successful than individuals lacking the trait. Thus, the allele that codes for the favored trait is passed on to more offspring, and becomes more common over time.
The result: the frequency of the dominant allele goes up over time. However, notice how the lines flatten as the frequency of the recessive allele drops. It is almost impossible to totally eliminate recessive alleles from a population, because if the dominant phenotype is what is selected for, both AA and Aa individuals have that phenotype. Individuals with normal phenotypes but disease-causing recessive alleles are called carriers. |
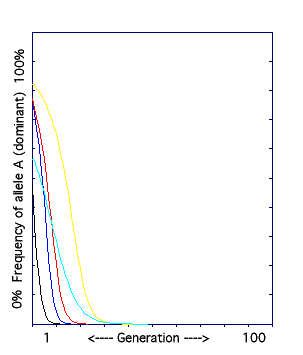 |
D. The Natural Selection Model II: recessive allele favored.
The frequency of the dominant allele is graphed over 100 generations. The dominant phenotype is selected against.
In this model, the recessive phenotype is selected for, and the dominant phenotype is selected against. (Perhaps the dominant allele causes a rare and lethal disease.)
The result: each of the five times that the model was run, the frequency of the dominant allele dropped to zero. The dominant allele was eliminated from the population even when its frequency was very high to begin with. When the dominant phenotype is selected against, any individual with even one dominant allele will have the undesirable trait, and so will have few or no offspring. In a relatively short time, only the aa individuals with the selected for recessive trait will be left. This is called purifying selection.
|
|
|
|
|