|
|
Enzymes
Enzymes are proteins which act as biological catalysts. They speed up the chemical reactions used by cells, but are not themselves permanently changed or used up by these reactions. Thus they can be used over and over again. Without enzymes, the cellular reactions required for life would not work fast enough to keep the organism functioning.
How a protein works depends on its 3-dimensional shape. Because enzymes are proteins, any factor that changes the shape of a protein also impacts the functioning of the enzyme. In general, enzymes are adapted to work best under the standard conditions found within the cell where they're used. As conditions shift away from the standard, enzyme efficiency drops.
|
Factors Effecting the Rate of Peroxidase Reactions
Peroxidase is an enzyme found in a wide variety of organisms, from plants to humans to bacteria. Its function is to break down hydrogen peroxide (H2O2), which is one of the toxins produced as a byproduct of using oxygen for respiration. (The fact that it's toxic is what makes hydrogen peroxide useful in first aid kits. We drip dilute hydrogen peroxide on cuts and scrapes to kill any bacteria which have gotten in, and so prevent infection.)
The peroxidase reaction is as follows:
2 H2O2 + peroxidase ---> 2 H2O + O2 + peroxidase
Water and oxygen are much less toxic than H2O2, and thus don't damage the interior of the cell. |
| Experimental Setup
We extracted catalase from turnips, and investigated the effects of four factors on the speed of the enzymatic reaction. The factors were: temperature, pH, substrate (here, H2O2) concentration, and enzyme concentration.
To track the rate of the reactions, we used the spectrophotometers and a reagent called guiacol. In the presence of oxygen, guiacol oxidizes from clear to brown. The more oxygen produced, the darker brown the guiacol becomes. We set up 10 mL reaction mixtures including guiacol, hydrogen peroxide, turnip extract, and a pH 7 buffer. We then took an absorbance measurement every second for a minute, and graphed absorbance (y) versus time (x). The slope of the resulting line was the rate of the reaction.
We began by running a standard reaction. To test each variable of interest, we then ran sets of three reactions to compare to our standard. For example, to determine the effects of substrate concentration, we made three sets of tubes that varied from the standard and from each other in only one way: how much hydrogen peroxide had been added. We recorded the slopes of the resulting lines and graphed the average reaction rates (y -- here, the dependent variable) against the factor being tested (x, which was our independent variable). The resulting curves showed the enzyme's optimum value for each factor and what happened to the reaction rate as the conditions moved away from the optimum. |
|
Temperature Effects
We ran our reactions at four temperatures: 0° C (freezing), 23°-25° C (room temp.), 37° C (human body temp.), and 100° C (boiling water). Temperature affects all chemical reactions, enzyme-catalyzed or not. In general, higher temperatures equal faster reaction rates. So why did our reaction slow down and eventually stop as we warmed up our test tubes?
The optimum temperature for turnip peroxidase fell near room temperature. Since turnips are not warm-blooded animals, it isn't surprising that their enzymes are adapted to an optimum temperature below 37° C. The optimum temperature probably reflects the soil temperatures in areas where turnips normally grow.
Though the reaction rate slowed down at 37° C, at 100° C the reaction stopped. Why such an extreme result? We cooked our enzyme. When you boil an egg, it goes from liquid to solid because the heat breaks and reconfigures the hydrogen bonds between amino-acids in the egg proteins. You permanently change the shape of the proteins, and so permanently change their qualities (in this case, texture). The same thing happened to our enzyme. The heat-induced reconfiguration of the hydrogen bonds permanently changed the shape of our enzyme, which caused it to cease functioning. When the shape of a protein is permanently changed, we say it has been denatured. |
Graphing Reaction Rates
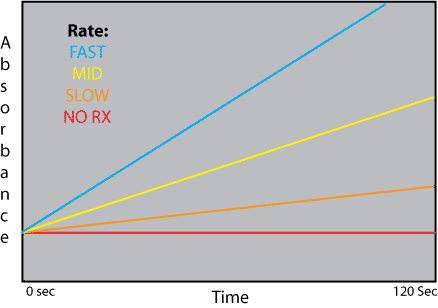
Aside from curves showing enzyme optima, there is another way to compare reaction rates under varying treatments. When we graphed our initial reactions on the spectrophotometer, we saw absorbance (on the y) versus time (on the x). We fit a line to the data points, and the slope (m) of that line was calculated as absorbance/time. Since absorbance correlated to the amount of oxygen produced by the reaction, absorbance/time can be thought of as amount of product/time, which is the same as the reaction rate. Thus, slope (or m) equaled the reaction rate, and the greater the slope, the faster the reaction rate. A slope of zero would be no reaction. (For example, people who tried to take reaction readings from their blank tubes saw a flat line). We recorded the slope of each line and then compared these between all our tests by graphing them as rate (on the y) versus environmental variable (for example, temperature).
Another way to compare the reaction rates under different conditions (like different temperatures or pHs) would be to place the best fit lines of each different absorbance vs. time graph together on the same chart. The steepest line would be the fastest reaction and thus the optimum condition for the enzyme (for example, room temperature). For example, if we put all four best fit lines from our temperature experiments on the same graph, they would look something like the figure below, with the blue line representing data from the room temperature tube, the yellow for 37°, the orange for 0°, and the red for 100°.
|

|
|
|
|