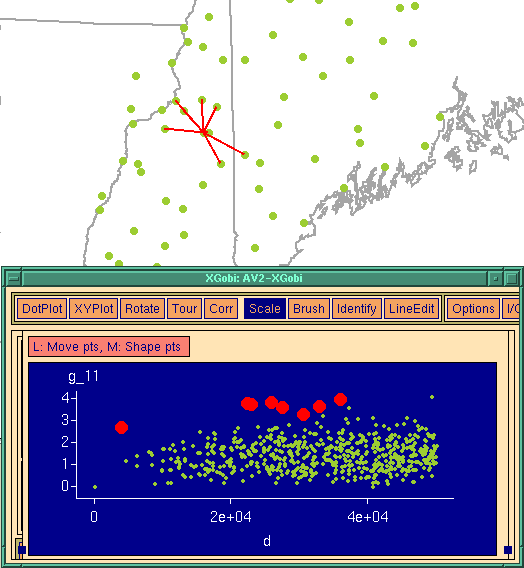
Figure 1 shows a variogram-cloud plot for precipitation sampling stations in which several potentially outlying points have been brushed. Because each point in the XGobi window corresponds to a pair of sampling locations, when the points in XGobi are brushed the Arcview window shows each pair of sampling locations connected by a line. This is also shown in Figure 1. Notice that all of the outlying points have a single sampling location in common. When the Arcview window is displayed with elevation contours, it is immediately obvious that the location in question is located on top of a mountain, which accounts for the large difference in precipitation.
If you are interested, click here to see documentation and download instructions for these tools.