Some thoughts for the course:
-
There are three kinds of lies: lies, damned lies, and statistics
-

- FACE: there are certain goals that we must strive to achieve everyday:
- Focus
- Attitude
- Creativity
- Effort

- Name (and the name that you want me to call you)
- Hometown
- What is your calling? ("a calling has to do with one's larger purpose, personhood, deepest values, and the gift one wishes to give the world.... A calling is about the use one makes of a career." David Orr, Earth in Mind)
- What is your dream job?
- What is something special about you?
- What is your height? (If you don't know it, we can figure it out!)
- Syllabus
- Tentative Schedule (with assignments!)
- An important resource: the Math/Stat lab (MEP 457)
The Math & Stat Lab will open soon (if not already). The lab is generally open M-R from 9-3, and F 9-12.
- Class agreement
- Great news! This course is cheap. We're using resources created,
for the most part, by our chair, Prof. Brooke Buckley.
You'll need to print out the packets. These are found off the homepage, linked to packets. Just print them off as needed (because we may be making changes along the way).
For next time, print off Packet01-NormalDistributions.pdf and bring it to class. We'll be filling it out as we go along on Thursday.
- What do we mean by "Statistics"? What is/are Statistics?
- Statistics are numbers ("descriptive statistics")
First Definition of Statistics: Statistics are numbers calculated from a collection of data
"Data": items of information, either numerical or non-numerical (quantitative versus qualitative)
Examples of statistics:
- baseball "averages"
- percent, proportion of NKU students that graduated from the same high school as one of their parents
- average height of NKU students
- percentages of students preferring each type of soft drinks offered on NKU campus
- Statistics is a science ("inferential statistics")
Second Definition of Statistics: Statistics is a science that deals with the collection and summary of information that is then used to make interpretations, decisions, estimates, predictions, etc.
Examples:
- Polio Vaccine trials
- Calling elections before some voters have even voted (and
certainly before most votes have been counted)
- What makes this easy?
- Why did the 2000 Presidential Election take so long to call?
- A more mundane example: Heights of NKU students:
How might we use the students in this class to estimate the average height of an NKU student?
- Let's try some inferential statistics. Inferential Statistics
is tied up with probability. We may hear someone make a statement,
and then we say "Nonsense!", or "That seems reasonable...."
But we may want to do more: we may want to test an assertion, to see what we can detect or infer from our examination of the data. And for that we'll need probabilities.
Here's a simple probability example:
- What's the probability of a 5 appearing on a throw of a die?
- What's the probability of an odd number appearing?
Here's another:
- How do we determine if a coin is fair?
- (Can we determine if a coin is fair in a single toss?)
(Of course we must always be on the lookout for anything funky about the setup.)
Example: So let's think about those NKU student heights:
- What's the probability that the class average height is above 7 feet?
- What's the probability that the class average height is below 7 feet?
- As we shift the "7 feet" part around, how will these probabilities
change? In particular, begin dropping the 7 towards 4, and what would
you see happening to the intuitive probabilities?
Let's think about how we might graph our intuition.
- Now let's figure out how we'd test some assertions:
- Suppose I assert that everyone in class is 6 feet tall.
- What could we do to test this assertion?
- In particular, why don't we generally need to know the height of everyone in class?
- What could we do to test these assertions (without simply
calculating the mean for the class! We're trying to be
clever....)?
- Suppose I assert that the mean (or average) height is 6.
- Suppose I assert that the mean (or average) height for men is greater than that for women.
- Suppose I assert that everyone in class is 6 feet tall.
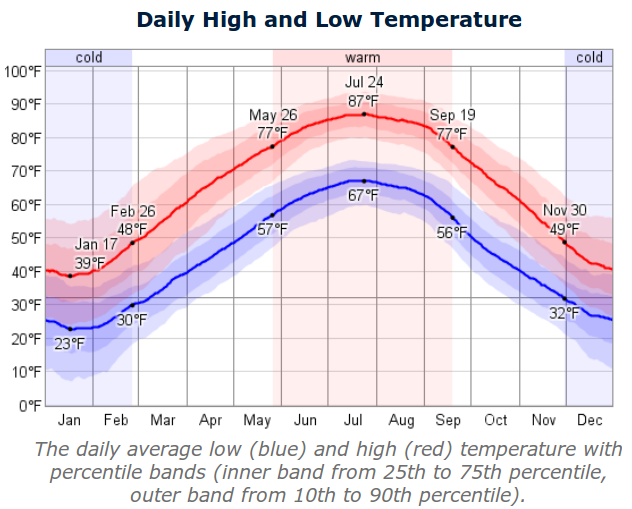
- What statistics are being shown in this graphic?
- How do we relate the statistics to probabilities?
- The high is forecast to be 41 degrees F on Thursday. How do you relate that to probabilities for this particular date?
- On Sunday, the high is forecast to be 15 degrees F. How do you relate that to probabilities for this particular date?
- This example illustrates distributions of numbers, rather than just a single number. Distributions will be very important in this course.
- Statistics are numbers ("descriptive statistics")
- A final example: Hearing Aids
- When I don't quite make out what you say, my mind goes through the possibilities: I hear
- I'd like to ____et you....
So I'm thinking
- bet -- that seems likely
- pet
- net
- wet
- set
- let
- I'd like to ____et you....
- When I don't quite make out what you say, my mind goes through the possibilities: I hear