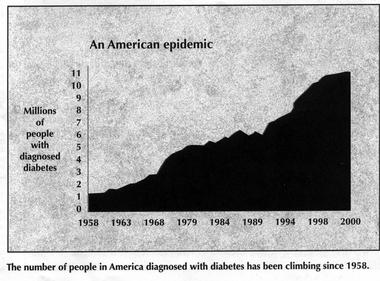
The x-axis is marked at changing intervals
(from the Mayo Clinic Health Letter, V21, #1, Jan. 2003)
Why might this be a more informative graph/function?
(from
http://www.fatlies.net/diabetes/
)
Website maintained by
Andy Long
. Comments appreciated.
 (from the Mayo Clinic Health Letter, V21, #1, Jan. 2003)
 (from http://www.fatlies.net/diabetes/)