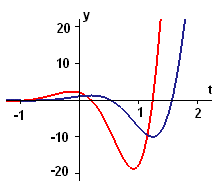

The figure shows the original function as a blue curve and the calculated derivative as a red curve. Both formulas have the form "exponential times trig function" — with the same exponential and same frequency — so their graphs should have similar shapes. Also, the derivative curve crosses the `t`-axis where the original function curve levels off, near `0.2` and `1.2.`