- Your quiz this week will cover section 3.1: Using derivatives to identify extreme values
- There are a couple of new IMath assignments, to get you thinking about finding extrema. They'd be good practice for the quiz....
- Once again we're going to jump around a little bit: we'll be doing section 3.5 next (Related rates); please read that section in advance of Wednesday.
- We had a quiz over inverse functions. Let's take a look at that:
- Key
- You need to observe that the function \(x^4\) fails the horizontal line test (that is, a give \(y\) value has more than one \(x\) value that gives rise to it); therefore, should we reflect that graph, the reflection would fail the vertical line test. The solution is to restrict the domain to some sensible subset of the actual domain.
- All you needed to do here is to reflect the graph over the
line \(y=x\); but carefully!
Note in particular that
- the function and its inverse only touch (or cross) on the line \(y=x\); and
- if \((x,y)\) is a point on the graph of \(f\), then \((y,x)\) is a point on the graph of \(f^{-1}\).
- This one was a little tricky; but first you needed to
compute \(g'(x)\), and a fair bunch of you forgot the chain rule!
The second "secret" is to write \(g'(x)\) in terms of \(g\) (because that makes the calculation of \(g'(g^{-1}(x))\) easy, since \(g(g^{-1}(x)) = x\).
- We discussed parametric families of sine curves as tone, or
notes.
- We looked at some additional L'Hôpital's rule problems, and formulations.
- We began consideration of section 3.1 (Using derivatives to identify extreme values). This is all part of using derivatives (and other information) to understand/graph functions.
- There are two important tests in this section which we were able
to deduce from these graphics:

- The first derivative test: Let $c$ be a critical number of continuous
function $f$.
- If $f^\prime$ changes sign from positive to negative at $c$, then $f$ has a local maximum at $c$.
- If $f^\prime$ changes sign from negative to positive at $c$, then $f$ has a local minimum at $c$.
- If $f^\prime$ does not change sign at $c$, then $f$ has neither a max nor a min at $c$.
- Second derivative test: Suppose $f^{\prime\prime}$ is
continuous near $c$.
- If $f^{\prime}(c)=0$ and $f^{\prime\prime}(c)>0$, then $f$ has a local minimum at $c$;
- If $f^{\prime}(c)=0$ and $f^{\prime\prime}(c)<0$, then $f$ has a local maximum at $c$.
- If $f^{\prime}(c)=0$ and $f^{\prime\prime}(c)=0$, then the case is indeterminate.
- The first derivative test: Let $c$ be a critical number of continuous
function $f$.
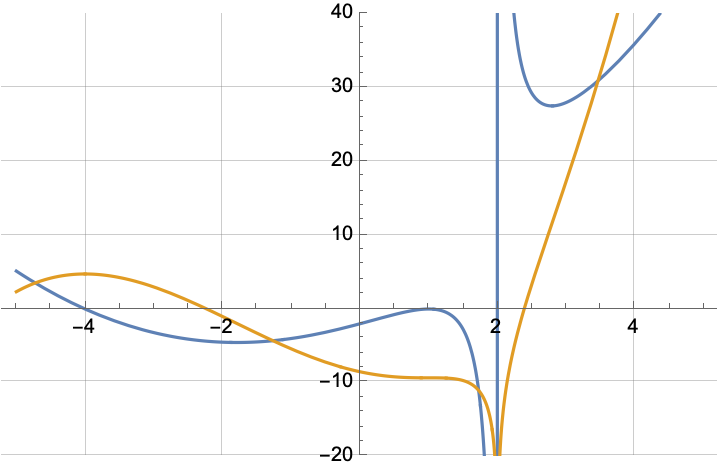
- Let's try out Activity 3.1.2 from this section.
Here's the graph of the derivative mentioned in the activity: \[ g'(x) = \frac{(x+4)(x-1)^2}{x-2} \]
What does the graph of the derivative look like as \(x \rightarrow \pm \infty\)?
- I'll turn you loose to work on your worksheet for 3.1.
We'll go over the solutions on Wednesday, before your quiz. These functions are a little tricky: it pays to have something to help you graph them as you work on these exercises.
- As a practical example of the "extremum finding process", we'll
finally take a look at that case study I've been lugging
around: Early Blooming
of the cherry trees in our nation's capital, inspired by a recent
article in the climate press.
- We begin with the big idea: we think that there is some
function that underlies the blooming time of the cherry
trees, on average.
We might expect that "the arrival of spring" is the big indicator: when the climate is screaming that spring has arrived, things begin happening such as the arrival of robins and the blooming of cherry trees.
There are perhaps a lot of "sub-climatic things" (such as total rainfall, or average cloud cover, or average temperature) that will impact the blossoming, but there is assumed to be some "trend" function that captures the overarching pattern.
- We will consider several mathematical models that capture
the early blooming. In particular, we would like to
establish whether
- Indeed there is evidence for earlier blooming
- An estimate for the number of days earlier the blooming is occurring (over the historical average), and
- What kind of model works best to capture the trend.
- We might start by examining the data, to see if we can
identify anything in particular: what do you think?
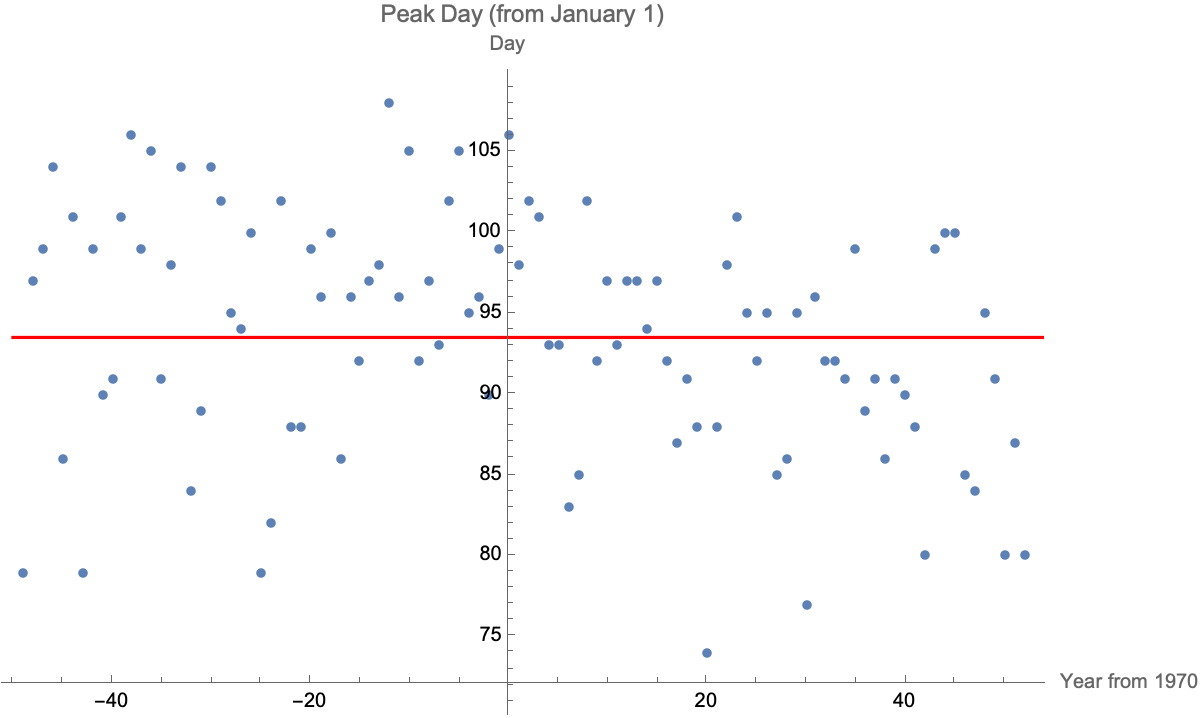
(the red line is the average across all years)
- A typical objective function (linear model):
\[
E(m,b) = \sum_{i=1}^{n} (y_i - (m x_i + b))^2
\]
We seek to minimize the "sum of squared errors" (this is the
sum of the squared errors between the model and the data over
all the data).
Ah ha! We see "to minimize" -- we seek an extremum.
The problem here is that the objective function is a function of two variables (\(m\) and \(b\)); we're doing "univariate calculus".
What we know, however, is that this procedure will lead to a choice of \(b\) so that the line passes through the mean of the data: \((\overline{x},\overline{y})\). This allows us to determine one of the parameters (we choose \(b\)), so it reduces to something like \[ E(m) = \sum_{i=1}^{n} (y_i - f(m;x_i))^2 \]
- The strategy is then to differentiate this function \(E\) with respect to \(m\), and set its derivative equal to zero; we'll then have an extremum (since all the terms are quadratics, they can get infinitely big, but only as small as zero): using the chain rule on this big sum, we get \[ E'(m) = \sum_{i=1}^{n} 2(y_i - f(m;x_i))f'(m;x_i) = 0 \] In fact, we're guaranteed to have a minimum (which is what we want).
- We begin with the big idea: we think that there is some
function that underlies the blooming time of the cherry
trees, on average.
- "All models are wrong; some models are useful." Because our data
is undeniably "noisy", our models must be wrong (built, as they
were, on faulty data); however we hope that they are useful!
- The basic linear model is simple, which is good, but gives
us no idea of the historical average. It does, however, provide
evidence that there has been a real change in blooming date,
and provides our first guess of how dramatic the change has
been over 100 years: about seven days (7.02047, to be precise
-- but that's silly, given the noise in the data -- better to
say "about seven days"!).
But it makes no sense as time continues to go further back: the blooming dates wouldn't have continued getting later and later, if the climate were relatively stable.
- The basic quadratic model argues for inflection -- it is,
indeed, an umbrella. But it makes no sense over 100 years, and
for the past -- the historical average would have been roughly
constant, if the climate were more constant.
- My choice for the final model would be a "cutpoint model" (either the linear or the quadratic models). They both show an "historical average" of around 95.5 days from the start of the year.
- The basic linear model is simple, which is good, but gives
us no idea of the historical average. It does, however, provide
evidence that there has been a real change in blooming date,
and provides our first guess of how dramatic the change has
been over 100 years: about seven days (7.02047, to be precise
-- but that's silly, given the noise in the data -- better to
say "about seven days"!).
- Cherry
blossoming data (from the EPA). Some "Key Points" cited in that webpage:
- Based on the entire 102 years of data, the average peak bloom date for Washington's cherry blossoms is April 4.
- Peak bloom date for the cherry trees is occurring earlier than it did in the past. Since 1921, peak bloom dates have shifted earlier by approximately seven days. The peak bloom date has occurred before April 4 in 16 of the past 20 years.
- While the length of the National Cherry Blossom Festival has continued to expand, the Yoshino cherry trees have bloomed near the beginning of the festival in recent years. During some years, the festival missed early peak bloom dates entirely.
- More generally, Leaf and Bloom Dates (EPA)