- Sandra will take her exam tomorrow, and I'll return the exams on Friday.
- For homework
- please read this short website about lead pollution.
- Finish the work we start today and submit your data set -- physical locations and your estimated lead levels for the Newport Foundry location (due Wednesday, 11/11).
From these locations and samples, we seek to estimate at neighboring locations. How should one do this? This is the fundamental question which we wish to consider.
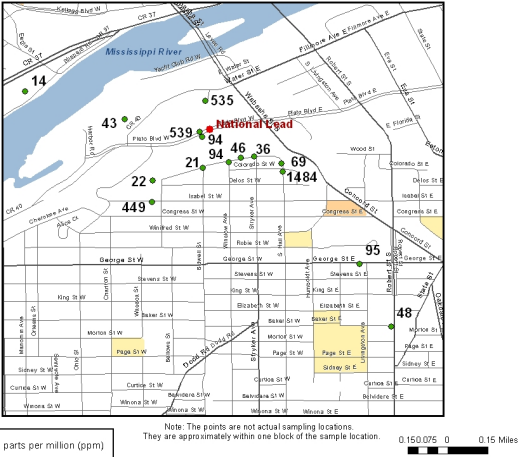
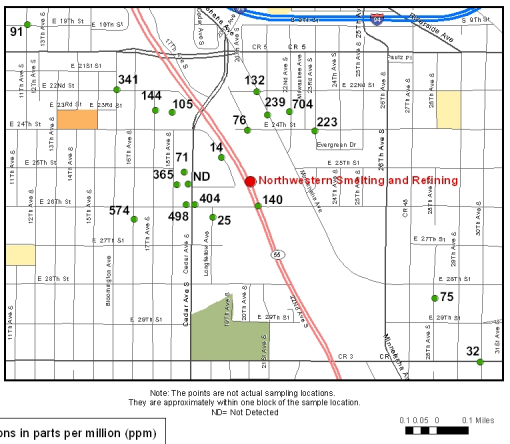
- The USA Today website has some limited data which we can use (via their "dig deeper" link).
- A better source for us to consider is this Superfund Final
Report (KY EPA), which includes a detailed map.
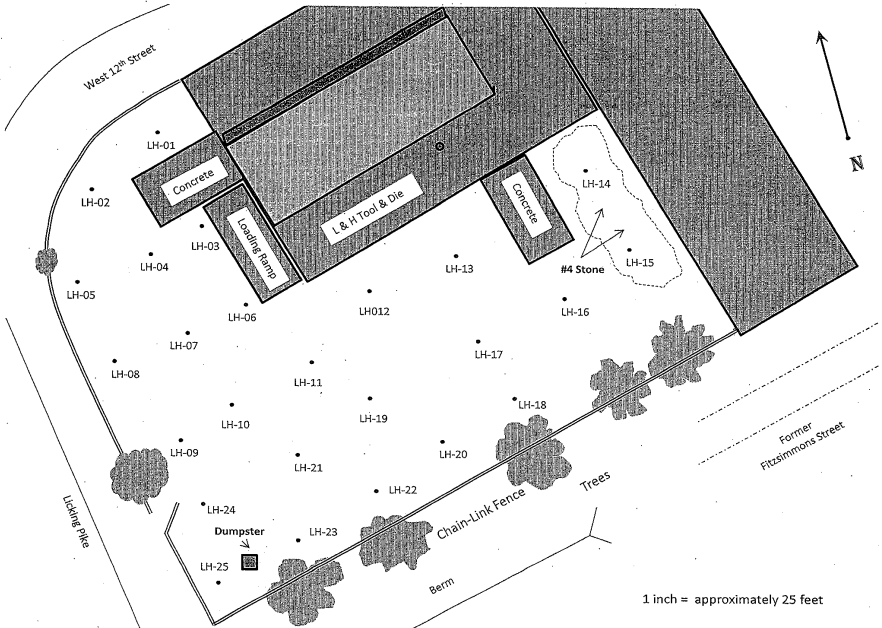
We will use their data to map the yard around the former smelter.
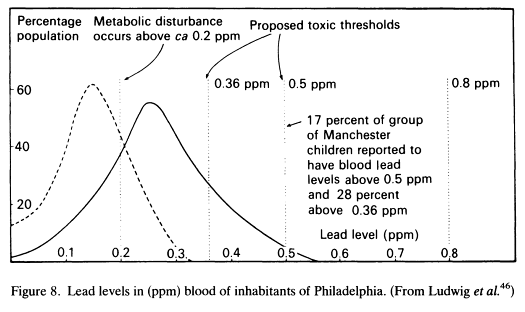
The dashed curve is suburban males; the solid curve is urban males.
- We need to get physical coordinates for the lead data in the vicinity of the smelter (Newport Foundry Inc) from the EPA study. (Why is the "1 inch = approximately 25 feet" a bad idea on this map?)
- We need to get physical coordinates for the lead data in the vicinity of the smelter (Newport Foundry Inc) from the EPA study.
- We can construct a soil lead profile, based on the tests at different levels.
- We can construct distributions of lead levels in different ways (by soil depth, say, and for Newport as a whole).