Knox Statistic for Space-Time Clustering
The Knox approach is used to test whether there is a statistically significant cluster within a defined distance and time period. The pairs of points within the specified space and time intervals are counted and compared to the expected number of points within the same intervals. A P-value based on the poisson distribution is then calculated.
Input
- The input file name. This file should contain X, Y coordinates and the
time associated with each event (for example, hours, days).
- The time interval of interest
- The distance interval of interest
- Output file name
Analysis
Low P-values indicate significant space-time clustering within the given time and distance intervals.
Formula
-
-
For the specified distance d and time period t, the Knox statistic calculates the following number:
 is the distance between points i and j
 is the time interval between points i and j
N11 is the total number of point pairs  with
with  and
and 
N12 is the total number of point pairs with and 
N21 is the total number of point pairs with  and
and
N22 is the total number of point pairs with  and
and
N is the total number of pairs of points 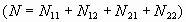
The P-value is: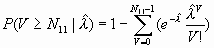
Where 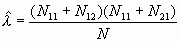 ,
,
and V is the number of pairs (0,1,…, N11-1) less than or equal to the observed pairs N11 that are contained within the specfied time and distance parameters
Output
- The input data file name
- The output file name
- The time and distance intervals specified
- The number of point pairs tabulated for N11, N12, N21, and N22
- E[N11], which is the expected value of N11
- The P-value
Example
For this example cases of an infectious disease during an outbreak over a period of 325 days will be considered. The data includes the X and Y coordinates in meters and the time in days, from the beginning of the epidemic, of the onset of each case. A sample of the input data file is shown in Table 1.
Table 1: Input File
X  Y  time
138902 58938 1
137625 59262 31
138431 58633 32
138637 58586 35
137738 58994 39
.  .  .
.  .  .
.  .  .
139641 61019 325
The disease is transmitted by a vector that is believed to operate over short distances (less than 35 meters). It is also believed that the symptoms of the victims would become evident within 5 days of infection. Consequently, we will use a space-time window of 35 meters and 5 days. The results of the Knox test are shown in Table 2.
Table 2: Output File
The input data file: epid.dat
The output data file: epid.out

DISTANCE    TIME    N11    N12    N21    N22    EN11     P  35.000      5.00    67     175    3507   39322  20.081   0.00000
The output shows that 67 pairs of points fell within the specified space-time window, and the expected number of points within this window (EN11) is calculated as 20.081. The very small P value indicates that there is significant clustering of cases within the space and time interval of 35 meters and 5 days.
References
Knox, G. (1964). The detection of space-time interactions. Applied
Statistics 13:25-29.