 [1]
[1]
where N is the number of points. di is the nearest neighbor distance for point i.
Nearest Neighbor Analysis
Nearest neighbor analysis examines the distances between each point and the closest point to it, and then compares these to expected values for a random sample of points from a CSR (complete spatial randomness) pattern. CSR is generated by means of two assumptions: 1) that all places are equally likely to be the recipient of a case (event) and 2) all cases are located independently of one another.
Input
You’ll be asked to enter the input data file, which should contain N rows of X, Y coordinates, and W values. Make all W values equal to 1, representing points.
Analysis
The null hypothesis of CSR is tested using the Z statistic (standard normal variate). A negative Z score indicates clustering; a positive score indicates dispersion or evenness. The Z statistic is calculated using the formula below.
Formula
[1]
where N is the number of points. di is the nearest neighbor distance for point i.
b) The expected value of the nearest neighbor distance in a random pattern
![]() [2]
[2]
where A is the area and B is the length of the perimeter of the study area.
c) The variance
![]() [3]
[3]
d) The Z statistic
 [4]
[4]
Equations [2] and [3] contain a correction factor to account for the boundary effect based on Donnelly (1978).
Output
The output file lists a) the input data file, b) the total number of points, c) the minimum and maximum of the X, and Y coordinates, d) the size of the study area, e) the observed mean nearest neighbor distance, g) the variance, and h) the Z statistic (standard normal variate).
Limitations
Equations [2] and [3] cannot be used for irregularly shaped study areas. In this program, the study area is a regular rectangle or square. Area (A) is calculated by (Xmax – Xmin) * (Ymax – Ymin), where these represent the study area boundaries.
Example
For this example of Nearest Neighbor Analysis we will consider Figure 1, which shows incidents of larynx cancer in the Chorley and South Ribble area of Lancashire, England. This data is available on Peter Diggle’s web site (http://www.maths.lancs.ac.uk/~diggle/pointpatterns/Datasets/). The null hypothesis (H0) is that the points are in a CSR pattern. The area used in the analysis is shown by the rectangle in Figure 1. The Xmin, Ymin, Xmax, and Ymax are shown in the output file (Table 2).
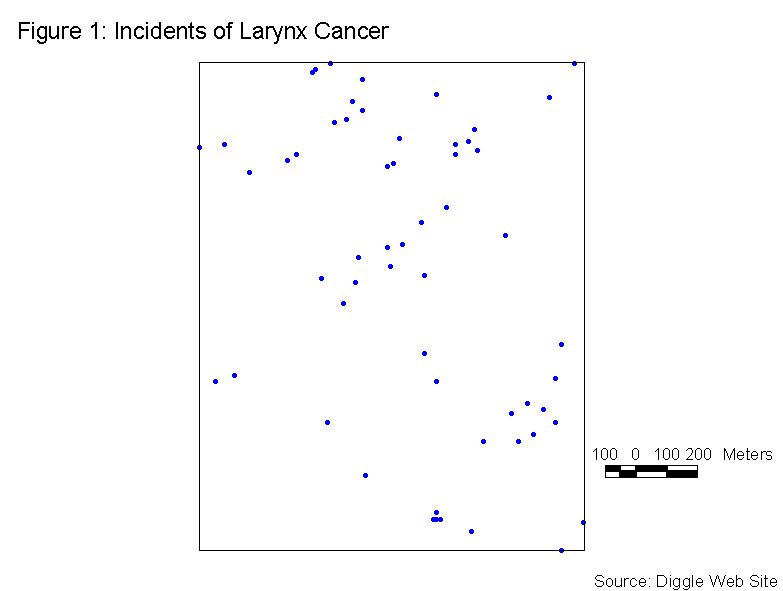
There are a total of 58 points in this sample. The input file is arranged in 58 rows of X, Y coordinates, and W values. Recall, all of the W values are equal to 1. A portion of the input data file is shown in Table 1.
Table 1: Sample of input data file
X	Y	W
35320	42800	1
35310	42230	1
34910	41850	1
35260	42080	1
35300	42150	1
35230	42660	1
36000	42850	1
34960	42500	1
35690	42570	1
.	.	.
.	.	.
.	.	.
34850	41830	1
For these data, table 2 shows that the mean nearest neighbor distance is calculated as 72.12 meters. The expected mean nearest neighbor distance is calculated as 96.41 meters. These two values are compared using the normally distributed Z statistic. The Z value from the tables of the normal distribution for a = 0.05 (2-tail) is +/-1.96. The calculated Z value is -3.40. The calculated Z value is less than -1.96, so we will reject the null hypothesis of a CSR pattern. The negative Z value indicates that a clustered pattern exists.
Table 2: Output File
The input data file: f:\ppa\larynx.txt
The total number of points:  58
The minimum x coordinate: 34800.000000
The maximum x coordinate: 36030.000000
The minimum y coordinate: 41290.000000
The maximum y coordinate: 42850.000000
The total area:   1918800.0000
 Observed mean, Expected mean,  Variance,    Z-value
      72.1181      96.4063      51.0905      -3.3980
References
Boots, Barry N. and Getis, Arthur, 1988, Point Pattern Analysis, Sage University
Paper series on Quantitative Applications in the Social Sciences, series no.07-001, Beverly Hills: Sage Publications
Diggle, Peter J., 1990, "A Point Process Modelling Approach to Raised Incidence of a Rare Phenomenon in the Vicinity of a Prespecified Point." Journal of the Royal Statistical Society A, 153(3), 349-362
Donnelly, K.P., 1978, Simulations to determine the variance and edge effect of total nearest neighbourhood distance, In Simulation methods in archeology, ed. I. Hodder, pp.91-95, Cambridge: Cambridge University Press