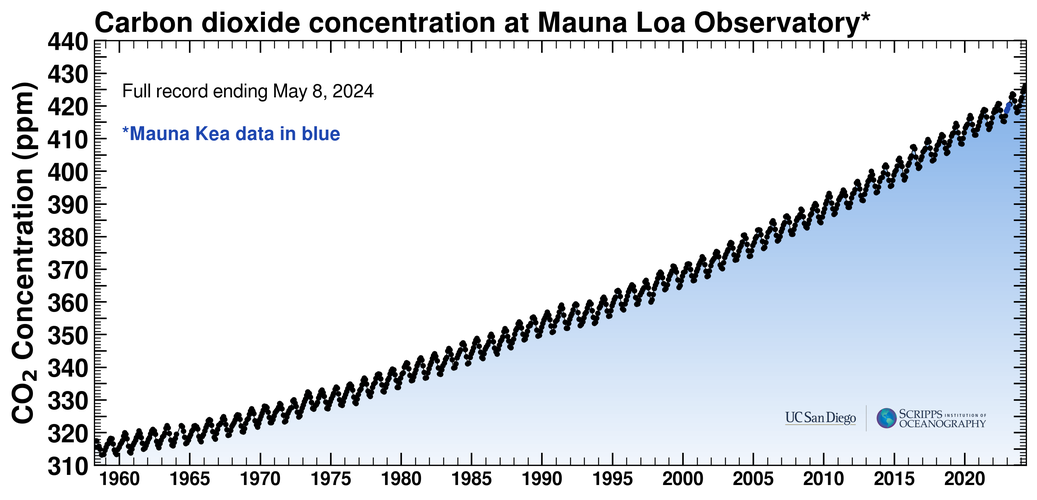
| There is a curve so beautiful to the mathematician that it set me off on this whole adventure of the study of climate change: it's called the Keeling curve, or the Keeling Data, in tribute to the man who began collecting it, and here it is: |
|
| There is a curve so beautiful to the mathematician that it set me off on this whole adventure of the study of climate change: it's called the Keeling curve, or the Keeling Data, in tribute to the man who began collecting it, and here it is: |
|
What makes it beautiful?
 (from Keeling's autobiographical Rewards and Penalties of Monitoring the Earth ) |
The data itself has been called "...the
most important envirionmental data set taken in the 20th century", and I
agree.
It tells a very important story, one which begins with Charles David
Keeling (American, 1928-2005).
|
Keeling was a young researcher in the late 1950s, and he felt that it was important to see what was happening to Earth's atmosphere. Was the carbon dioxide level actually building up because of human activity, or was the ocean absorbing all that carbon that humans were throwing up into the air? That was his question, and it turned out that the answer (and the data he collected) would make him famous.
Well, not rockstar-famous -- but, you know, famous among scientists. That probably seems like a pretty lame form of famousness....
It's not just that he collected important information, but that he collected it so well: "Charles David Keeling was a stickler for precision. The measurements of CO2 he began in the 1950s were an order of magnitude more accurate than previous measurements. In recognizing the value of a continuous record, and obtaining it, he brought a clarity to the problem that altered our perceptions about global change and the degree to which the Earth can absorb the human assault." -- Dr. James Hansen, in his Is There Still Time to Avoid `Dangerous Anthropogenic Interference' with Global Climate?: A Tribute to Charles David Keeling.
Keeling began his work at Caltech, in Pasadena, CA, in the early 1950s. He got hooked upon constructing a sensitive device for measuring atmospheric CO2 (a precision gas manometer), and soon he was taking readings up and down the west coast of the U.S. He discovered a day/night variation, which he was able to attribute to plant respiration and soils shedding CO2 differentially during the day. CO2 levels were about 310 ppm. In 1956 Keeling proposed a global program in atmospheric CO2 concentration at different sites around the world, including the South Pole and at Mauna Loa, in Hawaii. The program received funding, through the end of 1958. The first observation at Mauna Loa had a reading of 313 ppm. He was surprised to see it rise steadily, however, to a maximum in May, followed by an equally steady decline into October. Keeling realized later what he was seeing: "We were witnessing for the first time nature's withdrawing CO2 from the air for plant growth during summer and returning it each succeeding winter." As Keeling continued monitoring CO2, he found that the cyclical pattern repeated, and that the yearly trend was a steady increase in CO2 level. These were two extraordinarily important observations.
Perhaps more importantly, the curve became a lightening rod for those who felt that anthropogenic climate change was a threat, and helped garner attention scientifically and in the public. It continues to play that role, and, as Hansen noted in his tribute to Charles David Keeling, "...first a few details about CO2. This Keeling curve may look almost like a linear increase. It is not. CO2 growth is closely related to fossil fuel use. We know two numbers accurately in the CO2 story. One number is the annual global CO2 increase, which we know for half a century, thanks to this record started by Dave Keeling. The second number is the global annual emissions of CO2 from burning of fossil fuels."
And it turns out, not surprisingly, that the two are very strongly correlated. It seems that about 57% of the CO2 burned ends up in the atmospheric record of Keeling.
Today we can watch 800,000 years of change in the CO2 record. But the tail end of that history, and perhaps the most important 50-some-odd years of that, is thanks almost entirely to Charles David Keeling, a climate hero.
There is a marvelous movie of 800,000 years of CO2 in our atmosphere on the site.
If you check out the graphs, notice that in spite of the Kyoto Protocol (1997), a treaty with the stated purpose of reducing greenhouse gas emissions, the planet has shown no evidence of a slow-down in CO$_2$ pollution. In fact, it appears from the graph that the trend is actually accelerating.
Keeling further observed that "[i]t has been over 40 years since Roger Revelle and Hans Suess (56) pointed out that the burning of fossil fuels was a large-scale geophysical experiment that 'if adequately documented may yield a far-reaching insight into the processes determining weather and climate.' There was no sense of peril then, just a keen interest in gaining knowledge. Now, four decades later, there is a hint, perhaps more than a hint, of peril. Nevertheless, and despite the heightened political awareness of the greenhouse problem indicated by the Kyoto meeting last winter, most governments have shown little heightened interest in environmental monitoring."
What is our "peril level" today?